

Between February and May 2026, the monthly average price of diesel rose 50%, and the truckload rate index rose 11%. More than 2.8 million federal roadside inspections show what filled the gap: tires and legal driving hours across fleets of every size, while cheap repairs kept getting done.
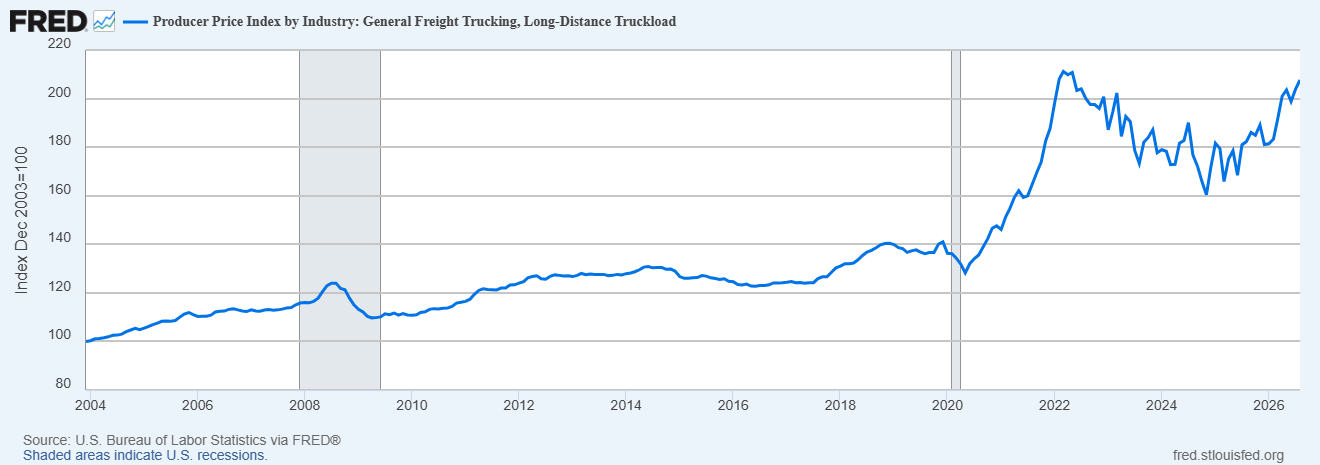
Rodney Nelson parked his rig across the diesel island at the High Forest Truck Stop on U.S. 63, south of Rochester, Minnesota, shortly after midnight on June 7, 1979. Four other members of the Minnesota Independent Truckers did the same, and by morning the diesel pumps at High Forest and at the B&F Truck Stop down the road were blockaded while the gasoline pumps stayed open. Nelson told Post-Bulletin reporter Marc Hequet he’d spent $18,000 on fuel the year before, close to a quarter of the $77,000 he grossed hauling out of Waltham. Diesel had climbed about 30% since New Year’s, to 85 cents a gallon in Rochester, and his freight rates had gone up 2%. He said he’d stay until the protest drew enough attention “so that they know in Washington.” Galen Kiehne of Stewartville, blocking the pumps at B&F, said diesel had gone for $1.13 a gallon in New Orleans the week before. “You can’t make ends meet,” he said.
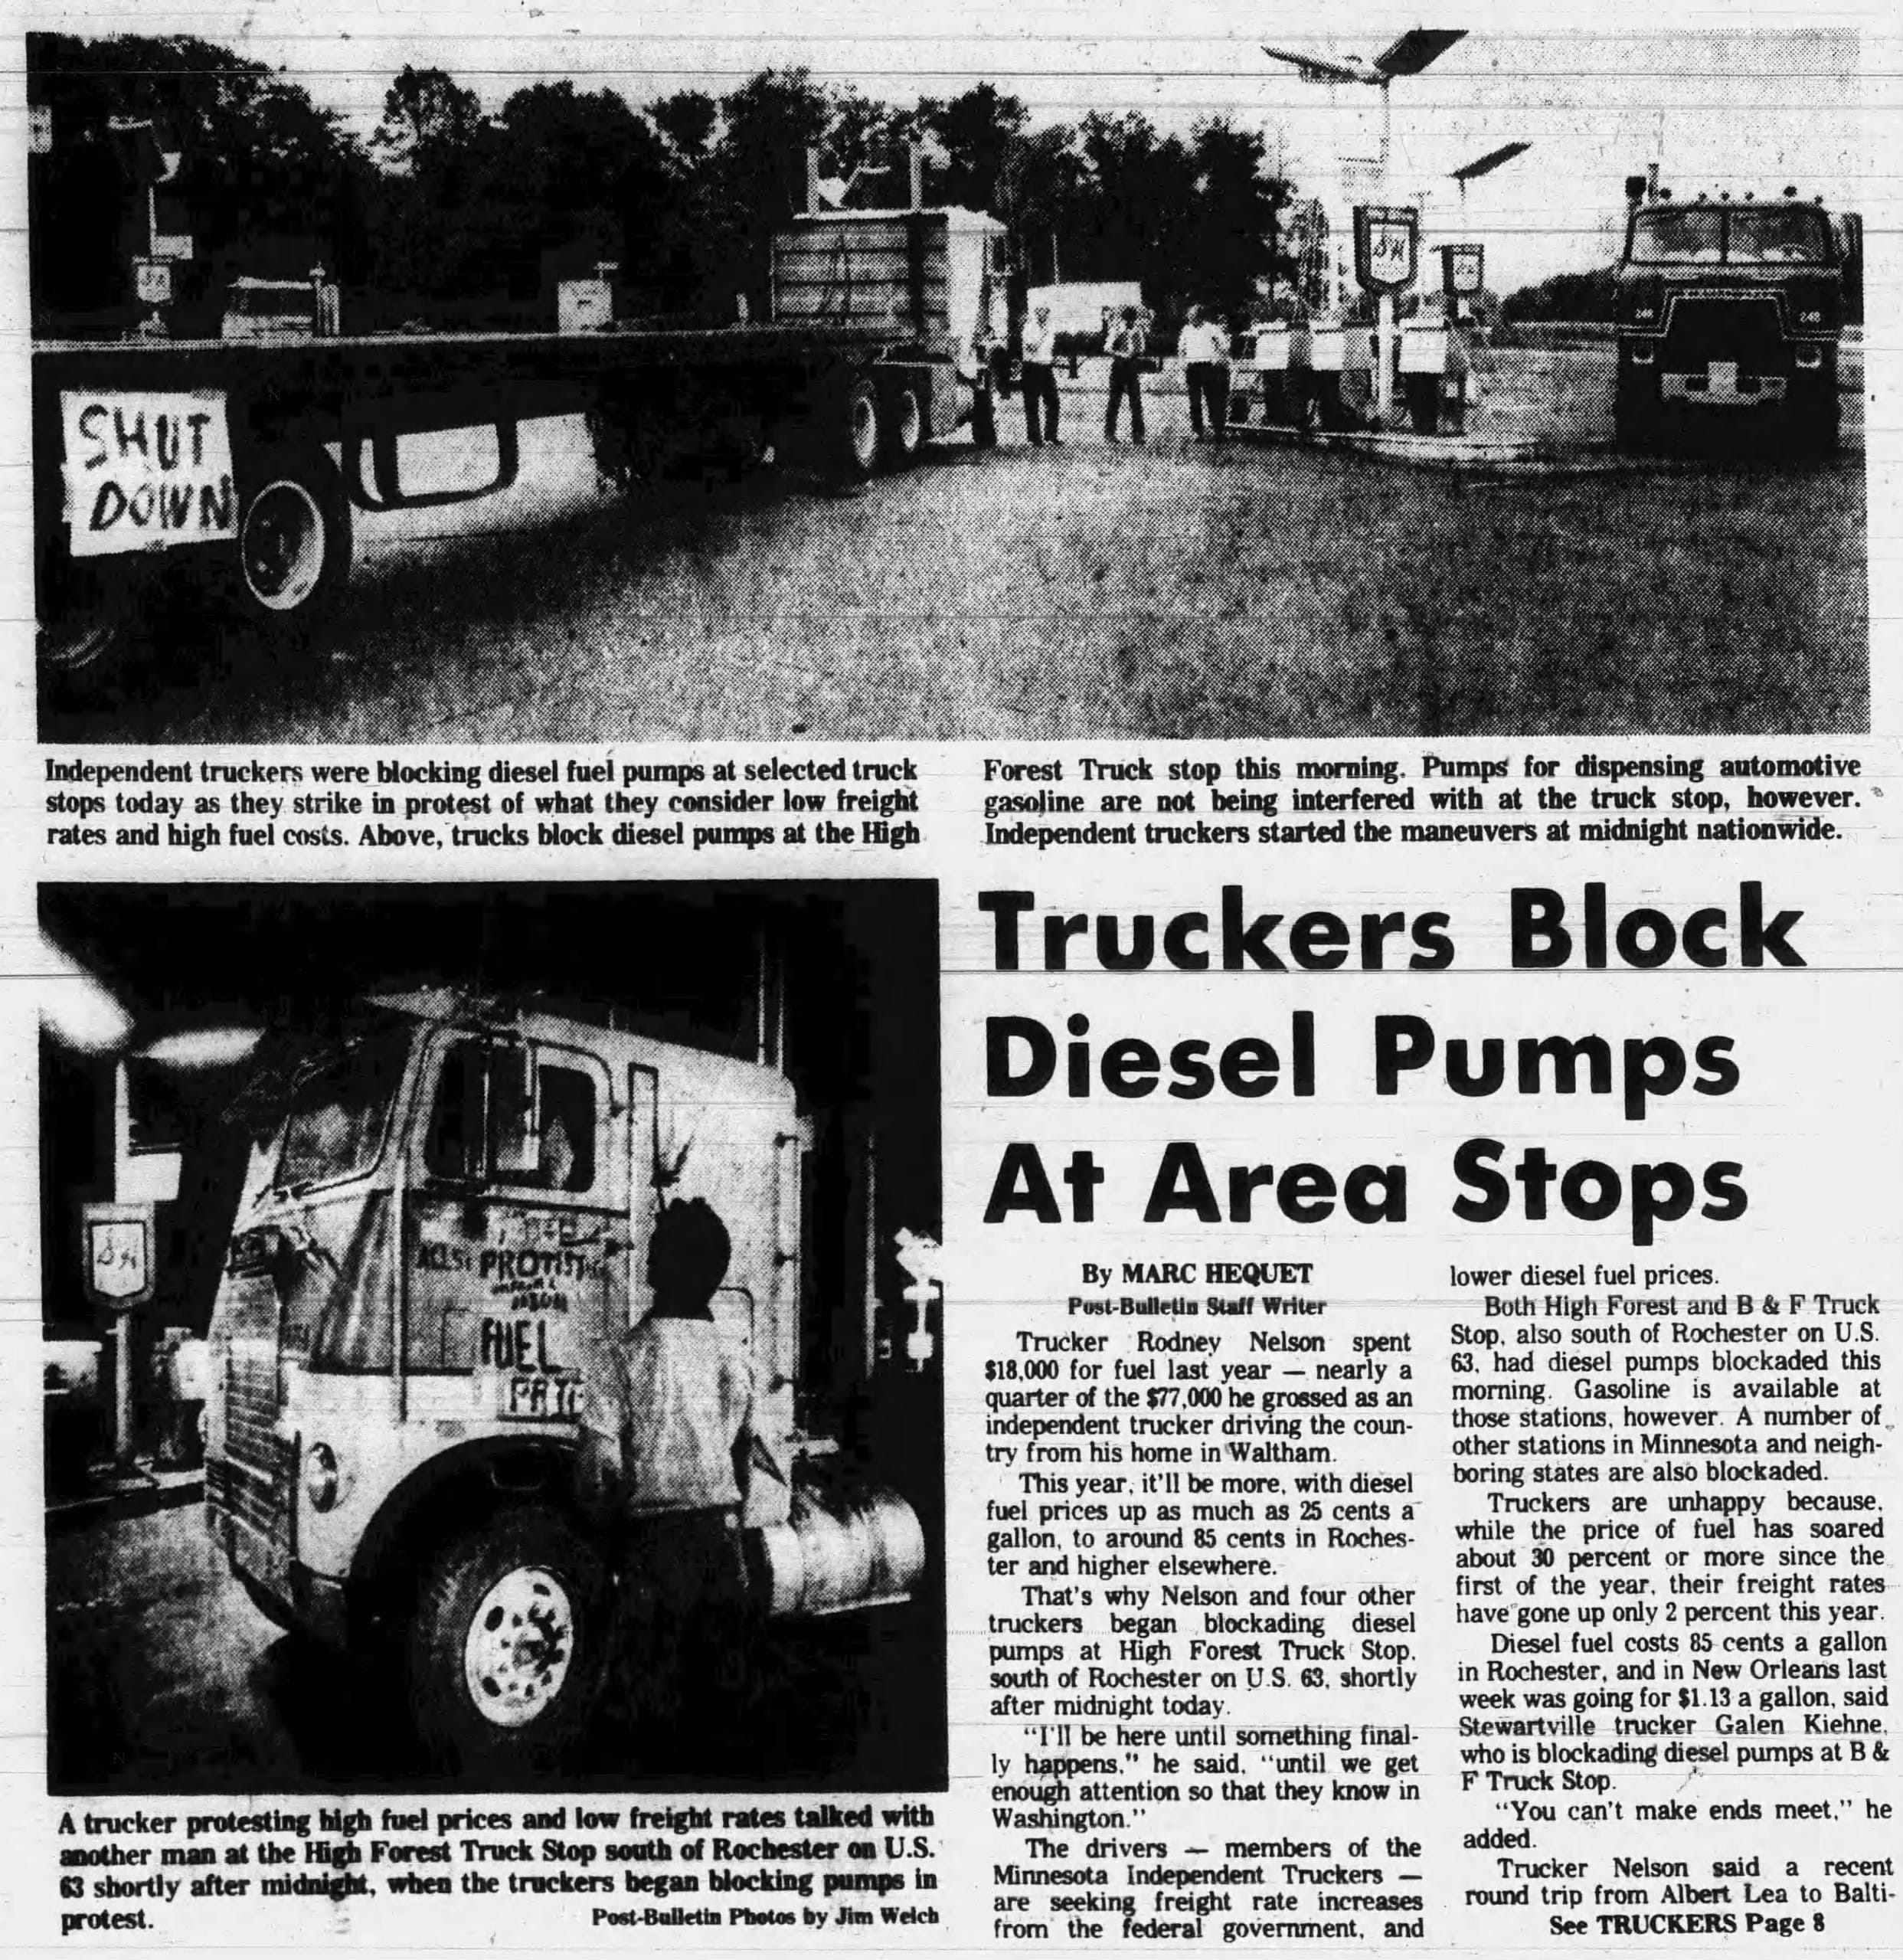
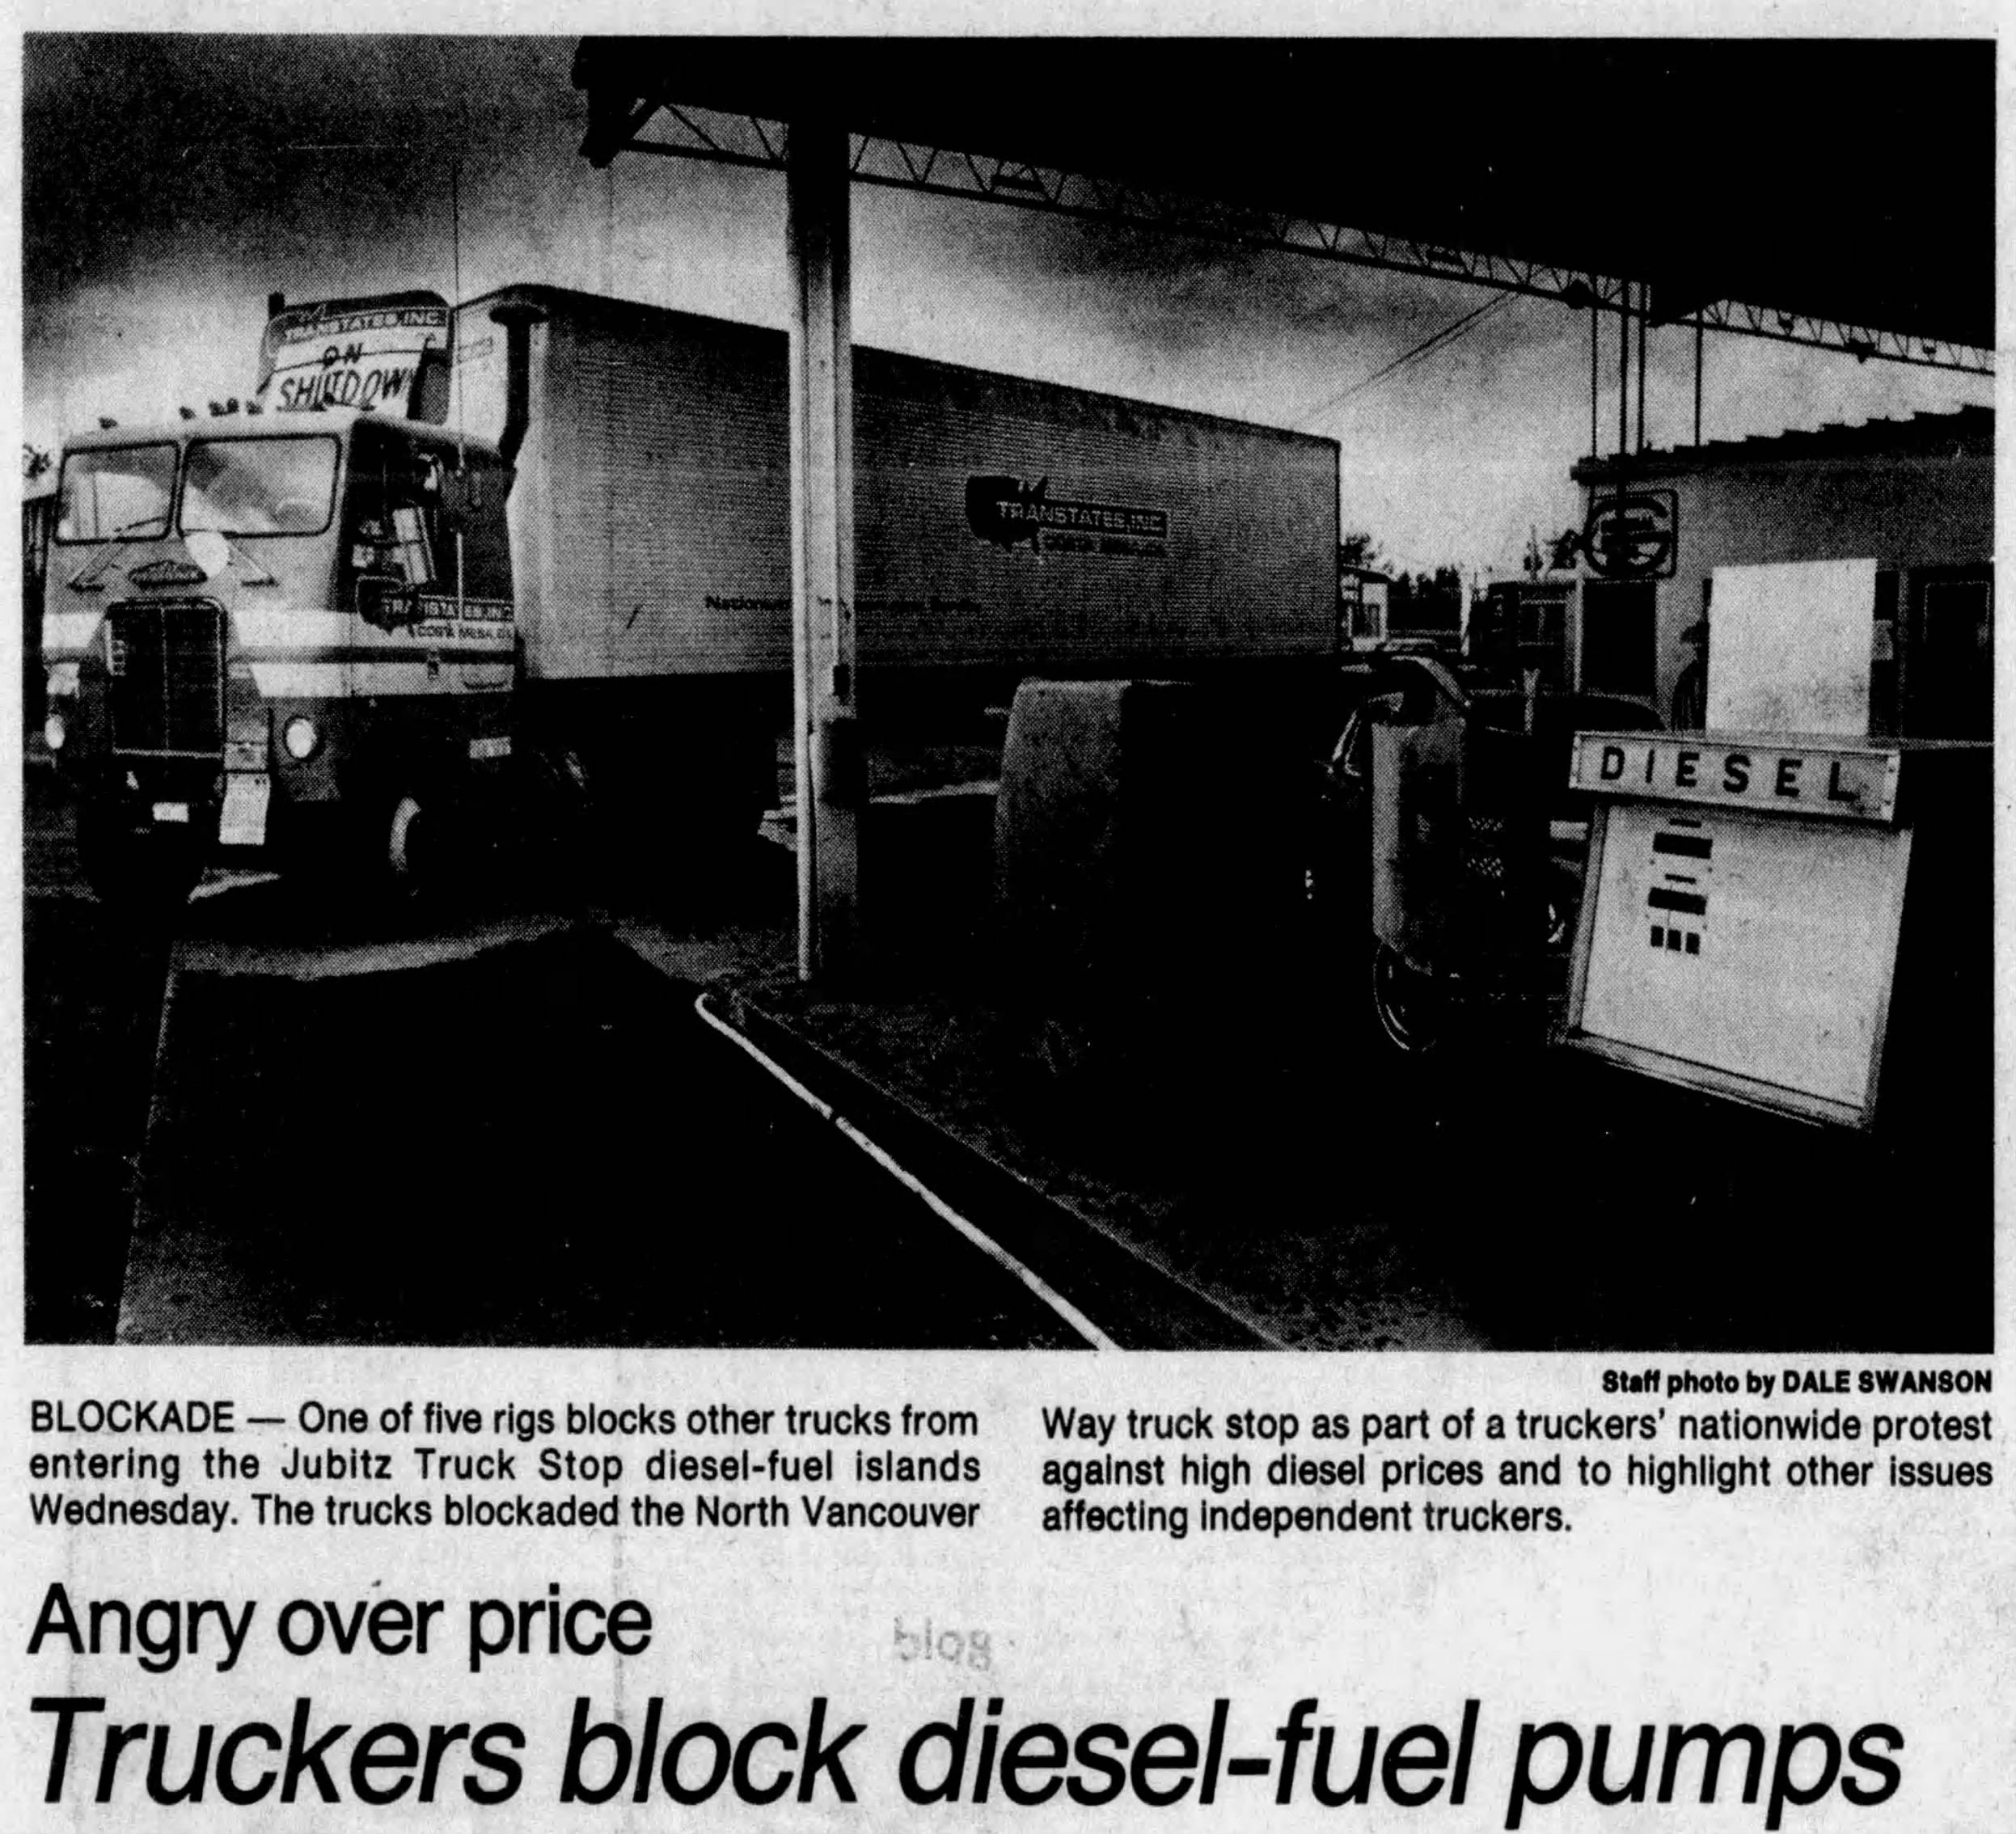
Five rigs blocked the diesel islands at the Jubitz Truck Stop on North Vancouver Way in Portland that week, one of them wearing a sign that read ON SHUTDOWN, according to The Oregonian. In Tennessee, independents shut down the diesel pumps at the Jellico Shell on LaFollette Pike and parked six 18-wheelers in front of them from Sunday into Wednesday, saying they couldn’t make a profit paying more than 75 cents a gallon. The local paper reported cut tires and gas lines, a fistfight and one arrest, a man who drove off from the station with a pistol, a rifle and a shotgun in his pickup. The Independent Truckers Association organized that shutdown, and the pressure it built fed the push that ended with President Jimmy Carter signing the Motor Carrier Act of 1980 on July 1, 1980, which stripped most federal control over trucking rates, routes, and entry. In 1979, the truckers blocking the pumps wanted Washington to raise their rates, because Washington set them. Nobody sets them now.
49 CFR 396.3 has no fuel clause. The regulation says every motor carrier “must systematically inspect, repair, and maintain” every truck under its control, and that parts and accessories “shall be in safe and proper operating condition at all times.” At all times means when diesel averages $3.72 a gallon and when it averages $5.60. The hours-of-service rules in Part 395 work the same way. A driver gets 11 hours behind the wheel inside a 14-hour window whether the load pays well or doesn’t, and the limit doesn’t stretch when the fuel bill does. Freight rates are a market price. Brakes, tires, and a rested driver are federal requirements, and the whole structure of motor carrier safety assumes the market price never gets paid out of the requirements.
I ran fleets across 28 states and more than 50 terminals before I wrote a word about this industry, and I know what a fleet budget looks like when fuel runs past revenue. The money comes from somewhere. It comes out of the lines a shipper never sees: the steer tire that runs another month, the brake job that waits for the next scheduled service, the driver dispatched on a load his clock can’t legally cover. When diesel went vertical after U.S. and Israeli strikes on Iran began in late February, I wanted to know whether that instinct shows up in the federal record, whether it shows up in the violations that cost money to fix or in every violation at once, and which carriers it hit. The industry’s working assumption is that fuel surcharge programs protect the big fleets and leave the small ones exposed.
The analysis runs on public data. We matched Federal Motor Carrier Safety Administration roadside inspection records to the violation codes written on each inspection and to the carrier’s power unit count in the FMCSA census file. That produced violation-level detail on more than 2.8 million driver inspections across six two-month windows between August 2024 and April 2026, plus out-of-service results on 3,655,772 inspections from June 2025 through August 2026. Fuel is the Energy Information Administration’s weekly U.S. on-highway diesel price, averaged by month. Freight rates are the Bureau of Labor Statistics producer price index for long-distance truckload general freight trucking (series PCU484121484121). Carriers fall into three classes: one to 10 power units, 11 to 100, and more than 100. Every rate in this piece is a share of inspections, not a raw count, so a rate doesn’t move just because inspectors worked more shifts.
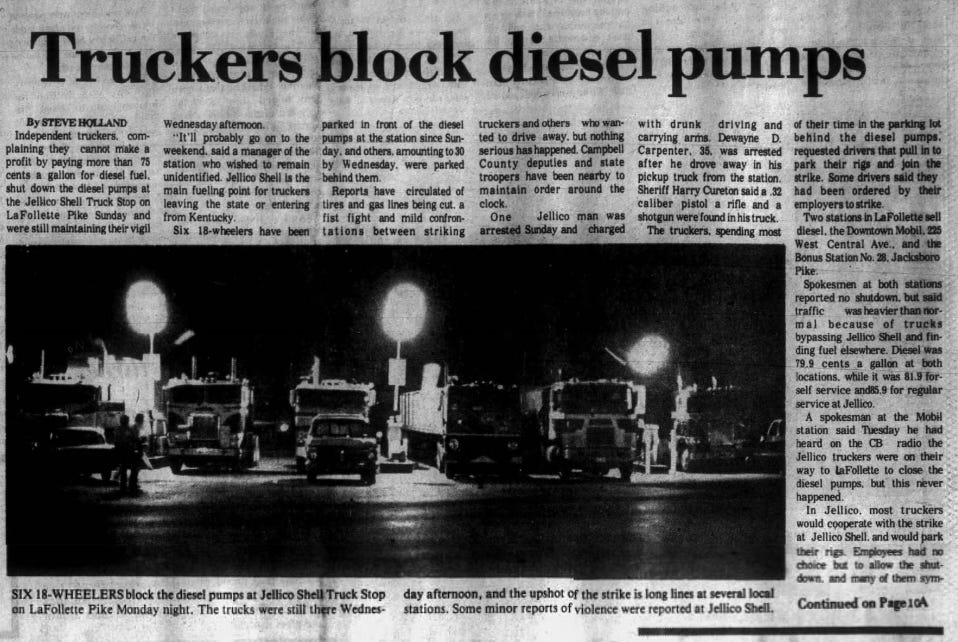
The monthly average price of diesel was $3.72 in February 2026. It was $4.92 in March, $5.50 in April, and $5.60 in May, up 50% in three months. The truckload rate index moved from 183.3 to 203.5 over the same stretch, up 11%. Diesel set a weekly record of $5.967 a gallon in the week ended Sept. 7, according to EIA figures reported by Argus, $2.26 above the week ended Feb. 23, before the strikes. It climbed again to $6.285 in the week of Sept. 14. The prior record of $5.81 was set in June 2022. In March and April 2026, compared with March and April 2025, hours-of-service violations rose 20.4% at carriers with 10 or fewer trucks, 12% at carriers with 11 to 100, and 8.6% at fleets over 100. Tire violations rose 8.9%, 10.9%, and 12.1% across the same three classes. Lighting violations, the cheapest defect to fix on a truck, rose from 0.9% to 3.8%. Seatbelt and texting violations, which have nothing to do with what a carrier spends, fell in every class, by 6.3% to 12.3%.
Those numbers don’t prove fuel did it, and some of what they show was already underway before diesel moved. Brakes are the first case. In January and February 2026, when diesel cost less than a year earlier ($3.52 in January against $3.63), brake violations were already up 6.8% to 10.7% over January and February 2025. The spring increase, 6.6% to 9%, was the same size, so the fuel spike added nothing to the brake increase that wasn’t already happening. Small carriers’ hours violations were also climbing before the war, up 9.1% year over year in August and September 2025, when diesel was flat ($3.70 in August 2024 against $3.74 in August 2025), and up 14.6% in January and February 2026. Rates rose during the spike too, and large fleets with contract fuel surcharge schedules collected more of that increase than a one-truck operator booking spot loads. On the driver side, the Commercial Vehicle Safety Alliance began placing drivers out of service for English language proficiency on June 25, 2025, which changed what a driver out-of-service rate means from that date forward. For that reason, the core findings use violation codes instead of out-of-service orders: an inspector writes the violation whether or not the out-of-service criteria change.
The fuel signal shows up at the carriers that weren’t supposed to feel it. Fleets with more than 100 trucks entered 2026 with hours-of-service violations falling. In January and February, the HOS violation rate for that class ran 7.4% below the year before, and mid-size fleets with 11 to 100 trucks were down 2.4%. Then diesel jumped, and in March and April the same two classes posted increases of 8.6% and 12% over the prior spring. Measured from the pre-spike trend to the spike, large fleets swung 16 percentage points on hours and mid-size fleets 14.4. Small carriers swung 5.8, because they were already climbing. Tires followed the same shape. Large fleets’ tire violations were up 4.2% year over year before the spike and 12.1% during it, a swing of 7.9 points, against 4.7 for mid-size fleets and 2.8 for small ones.
That’s measured. This next part is my read. The fleets that were supposed to be insulated by fuel surcharge programs made the sharpest turn, and the carriers that were already sliding kept sliding. A contract surcharge reimburses with a lag, usually indexed to the prior week’s national average, and it usually pays on loaded miles, not empty repositioning, idle time, or freight booked all-in before the price moved. When diesel climbs 50% in 90 days, the lag alone is a cash problem for a fleet that spent three years running on the margins this market left it. For small carriers, the spike landed on a slide the record shows began at least a year earlier.
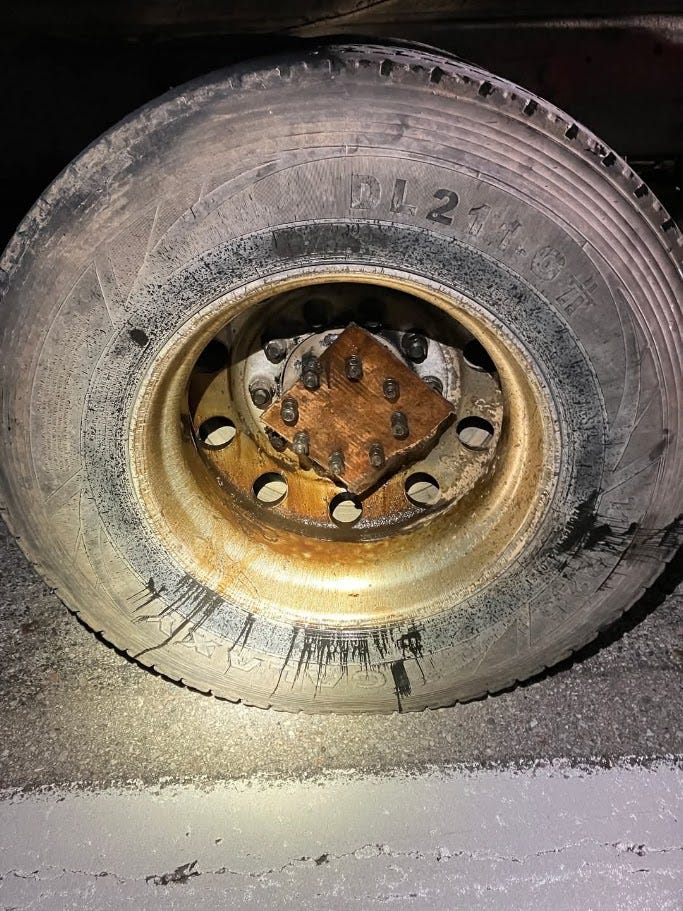
Tire violations are 49 CFR 393.75, which covers exposed ply or belt material, tread and sidewall separation, flat and audibly leaking tires, cuts to the fabric, and tread depth. A steer tire needs 4/32 of an inch of tread, and every other position needs 2/32. Brake violations are 393.47 and 393.48, plus the brake adjustment violations written under 396.3(a)(1). Hours violations are 395.3 (the driving and on-duty limits) and 395.8(e) (a false record of duty status). The control group is 392.16, the seatbelt rule, and 392.80, the ban on texting while driving. A carrier saves nothing when a driver skips his seatbelt. It saves money every week a steer tire stays on the truck.
A carrier’s hours come with their own paper trail. Under 49 CFR 395.11(c), a carrier has to keep the supporting documents that verify a driver’s log, and FMCSA guidance says the retention period is six months. FMCSA’s list includes bills of lading, dispatch records, expense receipts, fleet communication records, and settlement sheets “that indicate what and how a driver was paid.” Those settlement sheets answer the part of this question roadside data can’t reach: whether drivers took a pay cut when fuel went up. Inspection records carry hours and equipment. They don’t include paychecks, so this piece can’t find driver pay.
In 2008, the monthly average price of diesel went from $3.31 in January to $4.70 in July, up 42%, while the truckload rate index rose 7%, from 116 to 124. The recession that followed pushed diesel down to $2.09 by March 2009 and dragged the rate index to 110.4. In 2022, diesel went from $3.72 in January to $5.57 in May, up 50%, and the rate index rose 6%, from 198.3 to 210.7. Carriers entered that spike after the rate index had climbed 36% in the prior 12 months, from 146.1 in January 2021, so the 2022 fuel bill landed on rates that had just run up faster than fuel did. Then the index fell from 211.1 in March 2022 to 160.3 in November 2024, down 24%. In February 2026, the month before diesel took off, the index stood at 183.3, below its January 2022 level. Diesel rose the same 50% it did in 2022, after three years of falling rates.
Diesel was the cheaper fuel when those trucks blocked the pumps. The historical pattern, according to the EIA, was diesel selling below regular gasoline except in cold winters, when heating oil demand pulled distillate prices up. That flipped in September 2004, and diesel has cost more than gasoline almost continuously since. The EIA gives three reasons: global demand for diesel and other distillates grew, led by Europe, China, India and the United States; the switch to ultra-low sulfur diesel raised production and distribution costs; and the federal excise tax on diesel is 24.4 cents a gallon, 6 cents more than the 18.4 cents on gasoline. A refiner can crack a diesel molecule into gasoline, and no process turns gasoline into diesel, so diesel carries the premium whenever distillate stocks run short.
The EIA attributed the run to tight global distillate supplies and elevated crude prices, and in September it said it expects U.S. distillate inventories to fall below 100 million barrels and stay under the five-year low through most of 2027. Refiners said on second-quarter earnings calls that the tight product market should last into next year and possibly longer, even if the U.S.-Iran conflict is resolved, because of infrastructure damage and low inventories. Argus attributed the price run to the war and to Ukraine’s drone campaign against Russian refineries.
California has the widest gap. For the week of Sept. 14, federal price data put California diesel at $8.04 a gallon, $1.75 above the national average of $6.29, and AAA had the state average at $8.42 on Sept. 21. Part of that spread is Sacramento. Since July 1, California’s diesel fuel excise tax has been 48.2 cents a gallon, and the state adds a 13% sales tax on diesel plus local district taxes, so the state’s take per gallon climbs every time the price does. Interstate carriers reporting under the International Fuel Tax Agreement pay California 97.9 cents a gallon. Arizona, one state east, taxes diesel burned in trucks at 26 cents a gallon, about a quarter of the California rate. The federal 24.4 cents applies in both.
Social media posts this month called for a nationwide truckers’ strike starting Oct. 1. The Owner-Operator Independent Drivers Association told Newsweek the strike talk looked like social media chatter, and Snopes found no organizer and no authoritative reporting behind it. Newsweek traced the call to an Instagram video posted by an unidentified man. The 1979 shutdown had an organization, a membership, and a demand a federal agency could meet. The 2026 version has a video, and the demand it would have to make- higher rates- goes to a market that doesn’t take petitions.
Say you run six trucks. Each one runs 110,000 miles a year at 6.5 miles per gallon, which is about 16,923 gallons. At February’s $3.72, that’s $62,954 a truck. At May’s $5.60, it’s $94,769, a difference of $31,815 a truck, or $2,651 a month, or $15,908 a month across your six trucks. The rate index says freight revenue came up 11%, and whether any of that reaches you depends on whether you’re hauling contract freight with a surcharge schedule or spot loads priced the morning you booked them. Your insurance premium is fixed for the policy year. Your truck notes are fixed. Your fuel is whatever the pump says. The lines on your budget that move are the ones with a calendar attached: the tire replacement, the brake job, the scheduled service, and how many miles you ask each driver to cover before the week ends. The federal inspection record from this spring shows carriers of every size moving two of those lines.
Brokers are buying from the carriers in this data every day. From March through August 2026, 30.2% of Level I, II, and V inspections on carriers with 10 or fewer trucks ended with the vehicle placed out of service, compared with 17% for fleets with over 100 trucks. Small carriers also carry roughly double the brake violation rate of large fleets and a 14.2% tire violation rate against 9.4%. A broker tendering spot freight in a fuel spike is tendering it to the class of carrier with the least surcharge protection and the worst equipment numbers, and since the Supreme Court’s unanimous May 14 decision in Montgomery v. Caribe Transport II, a state-law claim that the broker picked that carrier negligently isn’t preempted by federal law. Shippers pay fuel surcharges on the invoice. Whether the surcharge reaches the truck that hauls the load is a separate question, and on spot freight that moves through a broker, the shipper usually has no way to know.
Insurers price this risk at renewal, a year after it shows up at the roadside. An underwriter reviewing a fleet this fall is looking at CSA data that includes the spring of 2026, and the tire and hours trend in this data applies to every size class on the book. Plaintiffs’ lawyers have a narrower clock. Supporting documents under 395.11 must be kept for only six months, so settlement sheets, dispatch records, and fuel receipts from March 2026 reached the end of their required retention in September. Maintenance records under 396.3(c) last longer: one year, plus six months after the truck leaves the carrier’s control. A preservation letter on a crash from this spring that doesn’t name settlement sheets, fuel receipts, and tire purchase records is leaving the fuel story out of discovery.
Drivers carry the hours side of this in their own bodies. A 20.4% jump in HOS violations at small carriers means more drivers are being logged past the 11-hour and 14-hour limits or logged falsely, and at a carrier with 10 or fewer trucks, the person asking for the extra hours is often the owner who signs the settlement sheet. Everyone else on the road carries the tire side. A steer tire under 4/32 of an inch has less grip on wet pavement, and it sits on the axle that decides where 80,000 pounds goes next.
Fuel surcharges were meant to pass the price of diesel on to the shipper. In spring 2026, the federal inspection record shows part of it went to steer tires and the logbooks instead. The fixes don’t require Congress. FMCSA already holds every data point in this analysis and could publish monthly violation rates by category and fleet size, so the next fuel spike gets measured in real time instead of reconstructed months later. The Commercial Vehicle Safety Alliance already runs a brake-focused week and a driver-behavior week on a calendar, and nothing stops it from pointing a tire and hours emphasis at the months when the EIA diesel average jumps. Brokers can weight recent tire and hours violations more heavily in vetting when fuel spikes and add surcharge pass-through language to carrier agreements. Insurers can add tire replacement intervals and a sample of driver settlement sheets to renewal questionnaires.
The violation detail in this analysis ends in April 2026. Diesel averaged above $4.95 every month after that and set its record in September, and the out-of-service data through August shows small-carrier vehicle out-of-service rates at or above 29.9% every month from March on. The next pull covers May through September, when diesel dipped in June and July and then set its record. If tire and hours violations track fuel down as well as up, the link gets harder to argue with. If they keep climbing no matter what diesel does, the story is a fleet that’s wearing out, and fuel is only the latest thing it’s wearing out under.
Somewhere this week a trooper at a scale house will set a tread depth gauge on a steer tire and read the number to the driver standing next to him. The regulation that number gets measured against was written for the family in the minivan in the next lane, not for the carrier’s fuel budget. No rule in Part 396 mentions diesel price. This spring, the trucks on the road were maintained as if there were one.