
The grid is full and your freight bill is about to reflect it
Rising electricity costs driven by data center demand, decades of grid mismanagement and structural policy failures are converging on cold chain infrastructure, reefer capacity and trucking rates.

Something isn’t adding up in Virginia. Virginia’s skyrocketing electric bills aren’t an anomaly; they’re the canary in the coal mine. The same data centers running your TMS and load boards are consuming so much power that they’re breaking the grid serving America’s busiest freight corridors. Cold storage operators, reefer carriers, and shippers are about to feel every kilowatt. Homeowners are staring at electric bills they’ve never seen. Landlords with completely vacant properties, no appliances running, and thermostats barely set above freeze protection are getting hit with $700 bills. One property investor I know is averaging nearly $20,000 a month in electricity across a portfolio of empty renovation homes. Virginia’s rates surged 13% in the most recent year-over-year comparison. Dominion Energy just got its first base rate increase approved since 1992.
If this were only a Virginia story, it would still matter. Virginia sits at one of the most critical intersections of port infrastructure, cold storage, and temperature-controlled distribution on the East Coast. But this isn’t just Virginia.
It’s Illinois, where electric prices jumped 16%. In Ohio, they climbed 12%. Georgia, where monthly Georgia Power bills have increased six times in two years and now average $175 a month. Maryland, where wholesale price spikes have pushed some residential bills up 80% in three years. It’s New Jersey. Pennsylvania. Indiana. Washington, D.C., where rates spiked a staggering 33% year over year.
The primary driver behind the surge is data centers. The same server farms running your AI tools, your load boards, your TMS platforms and your ELD backends are consuming so much electricity that they’re fundamentally distorting power markets across the country.
The supply chain, especially the cold chain, is absorbing the cost.
Before we get into what this means for freight, you need to understand that data centers didn’t create America’s grid vulnerability. They exposed one that’s been building for 30 years. The server farms are the accelerant. The kindling was stacked by a series of policy decisions, market restructurings and infrastructure neglect that systematically stripped resilience out of the U.S. power grid.
Start with deregulation. In 1996, California became the first state to deregulate its electricity market. The promise was that competition would drive prices down. By 2000, energy traders, most notoriously Enron, had figured out how to game the system. They took power plants offline during peak demand to manufacture shortages. They bought California electricity at capped prices, shipped it out of state and sold it back at multiples. Wholesale prices surged 800% in eight months. PG&E went bankrupt. Rolling blackouts hit millions. The crisis cost the state an estimated $40 billion to $45 billion.
The lesson should have been clear. It wasn’t. Today, 18 states plus D.C. have some form of electricity deregulation, and the numbers tell the story: as of March 2025, average electricity prices in deregulated states sit at 21.66 cents per kilowatt-hour versus 15.33 cents in regulated states. That’s 41% higher. And nearly every state getting hammered right now, Illinois, Ohio, New Jersey, Pennsylvania, Maryland, Virginia, is a deregulated, competitive-market state.
Then came the great coal retirement. Between 2010 and early 2019, power companies retired more than 546 coal-fired units totaling roughly 102 gigawatts of capacity. A record 14.9 GW went offline in 2015 alone. By the end of 2026 the United States will have shut down half its total coal generation capacity, dropping from a peak of 318 GW in 2011 to about 159 GW. Coal’s share of U.S. electricity fell from 51% in 2001 to roughly 19.5% by 2022.
Those coal plants were baseload generation. They ran around the clock. When they were retired, they were mostly replaced by natural gas, which introduced price volatility, and by wind and solar, which are intermittent and require backup capacity and grid storage that doesn’t yet exist at scale. Here’s what matters: 58% of planned coal retirements through 2028 are concentrated in the Midwest and Mid-Atlantic, the same PJM Interconnection footprint where data center demand is surging fastest. We are removing generation capacity from the exact geography where demand is exploding.
Nuclear is just as bad. Twelve U.S. reactors permanently closed between 2013 and 2021, every single one in a deregulated, competitive market. Academic research found that each closure increased state-level carbon emissions by 6% to 8% because the grid substituted dirtier fossil-fuel generation. Twenty other reactors were saved from closure only through state subsidies totaling roughly $100 million per reactor per year in Connecticut, Illinois, New Jersey, New York, Ohio, and Pennsylvania. Now the tech companies driving the data center boom are scrambling to restart nuclear plants and build new ones. Microsoft signed a 20-year deal to restart Three Mile Island Unit 1. The industry spent a decade shutting down nuclear plants and is now spending billions to bring them back because the grid can’t support the load without them.
Layered on top of it all are the renewable portfolio standards that 29 states enacted over the past two decades. A comprehensive University of Chicago study found that those mandates increased retail electricity prices by 11% within seven years and 17% within 12 years. Consumers in those 29 states paid $125.2 billion more for electricity than they would have without the policies. The hidden costs, backup capacity for intermittency, massive new transmission lines to reach remote generation sites, and premature displacement of existing baseload power were larger than most analyses ever accounted for.
Each of these structural shifts added a few percentage points to electricity costs. They compounded quietly for years while prices remained flat at around 13 cents per kWh from roughly 2007 to 2019. Then data centers arrived at an industrial scale, and the whole thing blew open.
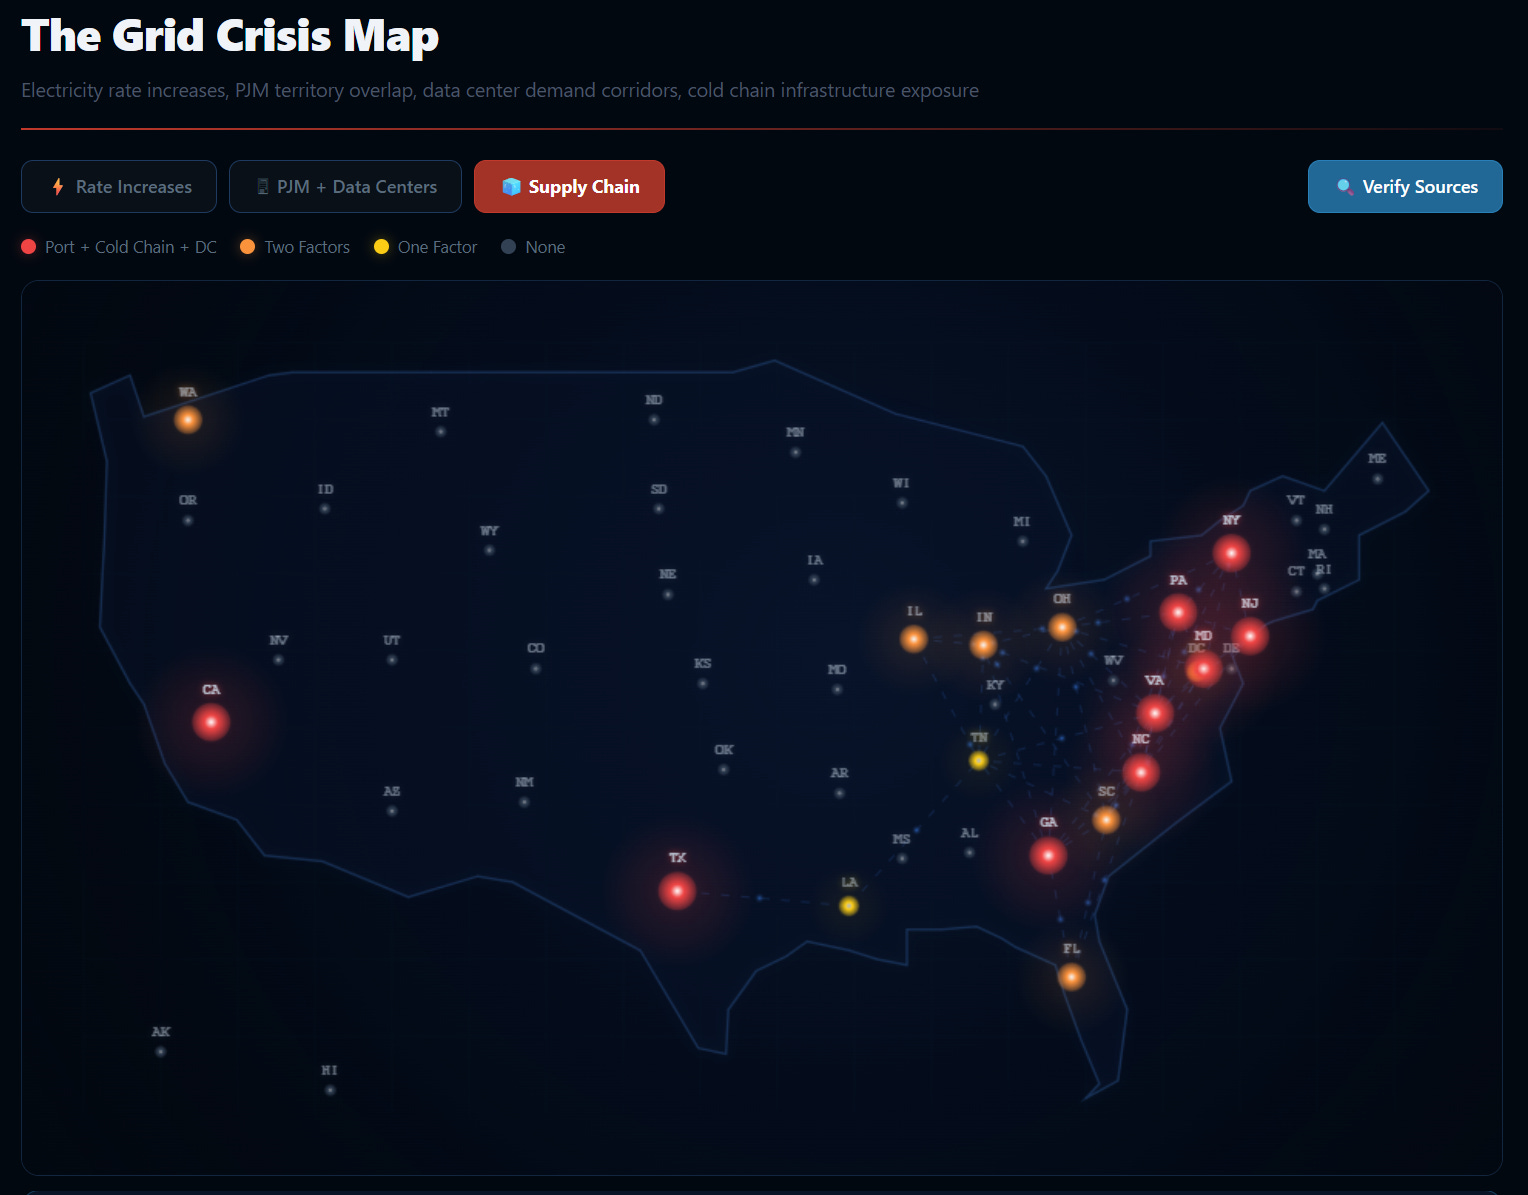
The epicenter of the damage is the PJM Interconnection territory, the largest power grid in the United States, serving 67 million people across 13 states and the District of Columbia. PJM covers Delaware, Illinois, Indiana, Kentucky, Maryland, Michigan, New Jersey, North Carolina, Ohio, Pennsylvania, Tennessee, Virginia and West Virginia.
It’s not just the grid. It’s the backbone of East Coast and Midwest logistics. Inside PJM’s footprint, you’ll find the Port of Virginia, the Port of Baltimore, Port Newark-Elizabeth, the Chicago intermodal hub, the I-95 corridor, the I-81 freight corridor, and the I-70/I-80 Midwest distribution belt. The densest concentration of cold storage, warehousing and freight infrastructure in North America sits on this grid.
Utilities requested more than $29 billion in rate increases in the first half of 2025 alone, double the amount from the same period in 2024. Rate increases affected about 40 million customers. Residential electricity prices rose 11.5% in 2025, outpacing inflation, and the EIA projects prices could increase up to 40% more by 2030. Average national electricity prices climbed from 13 cents per kWh in 2019 to 19 cents by the end of 2025. Forty-four states and D.C. saw year-over-year cost increases in December 2025.
PJM runs capacity auctions to ensure enough generation exists to keep the grid reliable. In 2024 the auction for the 2025-2026 delivery year produced a bill of $14.7 billion, a more than 500% increase from the prior year’s $2.2 billion. An independent watchdog found that data center demand accounted for $9.3 billion of that total, roughly 63%. The following auction jumped another 10% to $16.1 billion. A Union of Concerned Scientists analysis tallied $4.3 billion in direct costs passed to consumers in 2024 across just seven PJM states, identifying 130 examples of utilities connecting data centers with expensive new transmission lines while passing costs to ratepayers under outdated rules.
PJM has warned that from 2026 the grid will have just enough capacity to maintain reliability. Data centers are connecting faster than new generation can be built, and PJM currently has no mechanism to stop those connections even when reliability is at risk.
Not all commercial electricity users are created equal. Cold storage is uniquely exposed because of the sheer intensity of its power consumption.
A refrigerated warehouse burns through approximately 25 kilowatt-hours per square foot annually, four to five times more than a standard commercial building. Refrigeration accounts for up to 70% of total operating costs. According to the Global Cold Chain Alliance, electric power represents about 10% of total cold storage expenses and utility costs overall can run 9% to 18% of revenue for cold chain operators.
When rates jump 10% to 15%, the math moves fast. A 100,000-square-foot facility consuming 2.5 million kWh annually absorbs tens of thousands in additional annual costs. For operators like Lineage Logistics, the world’s largest cold storage company with facilities spread across multiple PJM states, or Americold with its own extensive network, the aggregate exposure runs into the millions per year. Those costs don’t evaporate. They flow into per-pallet storage rates, handling fees, drayage surcharges, and the price per case for every temperature-controlled SKU that moves through the supply chain.
I’ve spent 25 years in this industry. I’ve watched cost pressures come and go. This one is different because it’s structural rather than cyclical. It doesn’t correct when demand softens or diesel dips. It’s embedded in the grid, baked into capacity auction results and compounding annually. And it hits every link in the cold chain simultaneously.
Virginia’s Port of Virginia processed 3.5 million TEUs in fiscal year 2024 and is pouring $1.4 billion into its Gateway Investment Program. Hampton Roads has 3 million square feet of freezer and cooler space within 20 minutes of port terminals. Lineage operates 12 facilities across the state. FreezPak just invested $77.5 million in a new 245,000-square-foot cold storage facility in Suffolk. Smithfield Foods, the world’s largest pork processor, is headquartered. The Dominion zone within PJM is projected to see a 121% increase in peak load by 2045. Georgia’s Port of Savannah has more refrigerated container capacity than any other East or Gulf Coast terminal. The state has 67 cold chain facilities with 189 million cubic feet of space, and its own utility regulator found roughly 80% of projected demand growth is driven by data centers. Illinois is a Midwest freight and intermodal powerhouse where rates jumped 16% and the governor signed emergency energy legislation in January 2026 because officials warned the state could face shortages. Indiana is now home to Amazon’s largest AI data center, 30 buildings planned across 1,200 acres in New Carlisle, and saw estimated monthly bills jump 20.9% in a single year.
The states with the highest data center concentrations overlap almost perfectly with the states anchoring America’s freight and cold chain infrastructure. That’s not a coincidence. Data centers are located in logistics corridors because they need the same things: highway access, fiber connectivity, proximity to population, and historically cheap power. They’re competing for the same grid, and commercial ratepayers are losing.
The industry should internalize the rising electricity costs in these corridors to directly compress reefer capacity and push trucking rates higher.
Start with the reefer fleet. Temperature-controlled trucking already operates on thinner margins than dry van because of the equipment cost premium and the fuel burden of running a refrigeration unit. A reefer unit burns roughly a gallon of diesel per hour, but it also depends on infrastructure that runs on electricity at every touch point: the cold storage warehouse where freight is staged, the cross-dock where it’s consolidated, the distribution center where it’s depalletized, and the grocery DC where it’s received. Every one of those facilities just got more expensive to operate in these states, and those costs are flowing into the rates those facilities charge carriers and shippers.
When cold storage operators raise per-pallet rates to cover electricity increases, that cost has to go somewhere. It gets baked into accessorial charges. It shows up in detention and demurrage fees because facilities dealing with higher costs have less patience for free time. It pressures transload operations. And it ultimately flows into linehaul rates because carriers operating reefer equipment out of these corridors are absorbing higher terminal costs, higher staging costs and higher fuel costs all at once.
There’s a secondary capacity effect too. If operating costs in PJM-corridor states and Georgia become materially higher than competing regions, you could see cold storage development shift to lower-cost power markets. New facilities get built in the Carolinas, in Tennessee, in Texas. That migration doesn’t happen overnight, but it reshapes distribution networks over three to five years, and in the interim, existing capacity in high-cost states gets tighter as operators defer expansion or consolidate facilities to manage overhead. Tighter capacity means higher rates. It’s the same supply-demand dynamic that drives every freight cycle, just triggered by a variable nobody had in their models until now.
For reefer carriers specifically, the implications cascade. Owner-operators running temperature-controlled freight out of Hampton Roads or the Port of Savannah or the Chicago market are going to see their per-stop costs climb as warehouse and DC operators pass through electricity increases. Large fleets with their own terminal infrastructure in PJM states are absorbing those costs directly on their P&L. Either way, it pressures rates upward, and in a soft freight market, that means margin compression, not rate recovery.
There’s the electric truck paradox. The entire economic case for battery-electric freight was built on the assumption that electricity is cheaper per mile than diesel. That math was modeled on yesterday’s rates. A single megawatt-class charger for a Class 8 truck pulls as much power as an entire neighborhood. Fleet depot charging infrastructure can cost $50,000 to $250,000 per charger before grid upgrades. Demand charges can account for 30% to 70% of a commercial electricity bill. When the underlying rate structure is already inflated by data center-driven capacity costs, those demand charges become devastating. Any fleet evaluating electric truck deployment in the PJM corridor, in Georgia, or in Texas, where ERCOT estimates data center demand will exceed 22,000 MW by 2030, needs to model current and projected rates, not national averages from 2023.
Regulators are telling the trucking industry to electrify on a grid that can barely keep the lights on in vacant houses.
Perhaps the most infuriating finding in all of this is that the cost burden isn’t being distributed equally.
A Yale Climate Connections analysis found that residential electricity prices increased by 25% between 2020 and 2024. Commercial prices rose only about 3%. Industrial prices actually fell by 2%. Data centers are consuming more kilowatt-hours than ever, but the prices they pay have risen only marginally. In some cases, they’re negotiating favorable rate structures, receiving tax incentives, or interconnecting under rules designed for a completely different era.
In Georgia, two incumbent public utility commissioners were voted out in November 2025 after residential prices climbed 41% in four years. Virginia’s incoming governor, Abigail Spanberger, won in a landslide partly by promising to make data centers pay their fair share. New Jersey’s governor-elect campaigned explicitly on electricity costs. States such as Ohio and Georgia have begun creating separate rate classes for data centers, and Maryland is developing new tariff structures for large-load users.
Cold chain operators don’t get to negotiate sweetheart rates with their utility. They don’t get data center tax incentives. They don’t have lobbyists at the public utility commission. They just get the bill.
The data exists to independently verify whether rising costs reflect actual increases in electricity consumption or are purely pricing-driven. The EIA Hourly Electric Grid Monitor tracks real-time demand and generation for every balancing authority in the country. EIA Form 923 provides plant-level fuel consumption data by month. The EPA’s Continuous Emissions Monitoring Systems provide hourly smokestack data from every major fossil fuel plant. If emissions are flat but bills are climbing, the story is pricing, not usage. PJM publishes wholesale pricing by zone so you can compare what the market is actually paying versus what’s hitting retail bills.
Cold chain operators, shippers, and carriers should be pulling this data and building it into procurement modeling. This isn’t a one-quarter blip. PJM’s load forecasts project sustained demand growth for the next 20 years. The era of flat, predictable, 13-cent-per-kWh electricity that lasted from 2007 to 2019 is over. It’s not coming back.
For every business that depends on electricity as a core operating input, cold storage, food processing, warehouse operations, fleet terminals, and truck charging, this isn’t a temporary rate cycle. It’s a permanent structural shift.
The grid is full. The cold chain is feeling it first. Your freight bill is next.
Key data sources: EIA Hourly Electric Grid Monitor; EIA Form 923; EPA CEMS; PJM Interconnection Market Data; Union of Concerned Scientists data center transmission cost analysis (October 2025); EESI data center power demand report (2026); Yale Climate Connections electricity price analysis (January 2026); CNBC data center electricity analysis (November 2025); NEADA Energy Price Update (November 2025); American Action Forum electricity price analysis (October 2025); Global Cold Chain Alliance Cold Chain Index; University of Chicago Energy Policy Institute RPS analysis; IEEFA coal retirement tracking; Hampton Roads Alliance; Georgia Department of Economic Development; Virginia SCC Case PUR-2025-00058.