

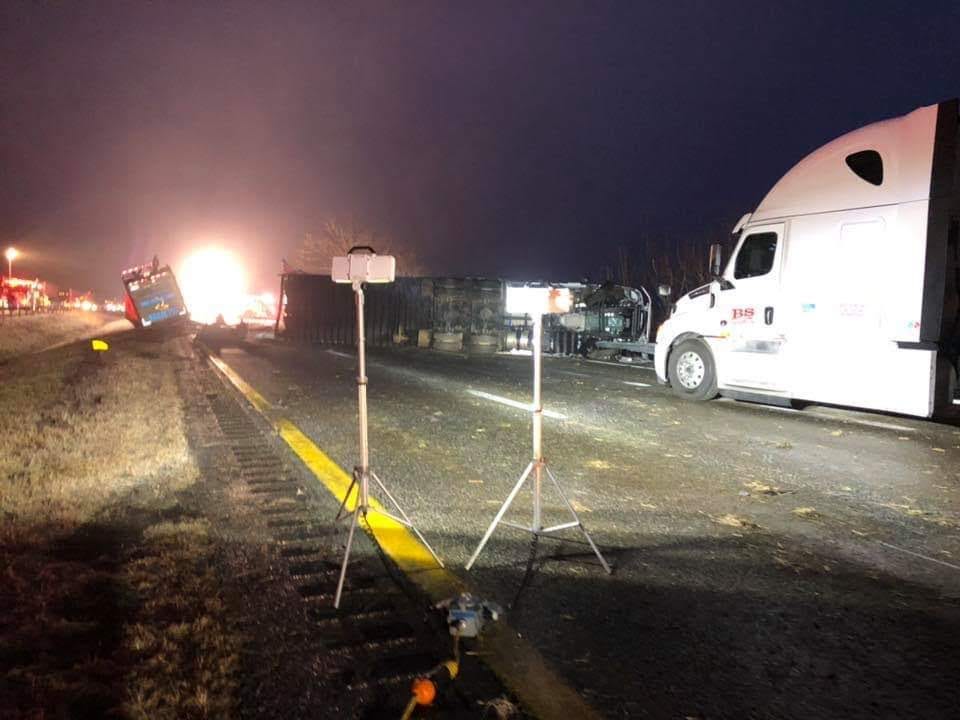
Pull 1,243,663 truck crashes from MCMIS and sort them by the hour they occurred. Not the count. The kill rate. Given that a truck crashed, how often did somebody die? Ten in the morning: 2.66 deaths per hundred crashes. Two in the morning: 5.27. Same trucks. Same drivers. Same roads. Twice the funerals.
Nine at night to six in the morning accounts for 18.3 percent of truck crashes and 27.5 percent of the deaths. If the overnight hours killed at the same rate as midmorning, 5,199 people in this file would still be alive. Test the industry’s favorite explanation and my own, and the data killed both. The answer is not what thirty years of regulation says it should be.
The fault rate doesn’t move
Most trucking statistics fall apart on the denominator. Somebody says a corridor is dangerous, and it turns out they counted crashes without counting how many trucks drove it. Somebody says a state is the worst for cargo theft, and it turns out that state just fills out more paperwork.
This number holds up because it never needs to know how many trucks were on the road. It is a rate, and the denominator is the number of crashes. I am not asking how often trucks crash at 2 a.m. I am asking, once a truck has crashed at 2 a.m., how often somebody dies. Traffic volume can’t touch that. Neither can exposure, miles, or fleet size. MCMIS only records crashes that meet the federal threshold: a fatality, an injury requiring transport, or a tow-away. There are no fender benders in here diluting anything. Serious crashes compared to serious crashes.
The industry has one explanation for night deaths, and it has held for thirty years: fatigue. Hours of service exist because of it. Eleven hours driving, fourteen-hour window, ten hours off, thirty-four-hour restart. (Yes, we know Passenger is different.) Every one of those numbers is a fatigue number. The 2013 restart rule went further than any of it, requiring two consecutive periods between 1 a.m. and 5 a.m. before a driver could reset. That was the government looking directly at the overnight hours and legislating against them. Congress suspended it in December 2014. It was dead by 2017.
The mainstream position is testable. If tired drivers are causing the overnight deaths, they should be more often at fault at night, and fault shows up as a citation. So I ran the citation rate by hour, dropping the unknowns and pendings.
Ten in the morning: 25.9 percent of truck drivers were cited. Ten at night: 23.2 percent. Two in the morning: 24.3 percent. Flat. Slightly lower at night, if anything. Across every hour of the day, in 1.2 million crashes, the share of truck drivers who did something a cop wrote down does not move.
The crash is no different at 2 a.m. Somebody just dies.
It is not the roads either. On a two-way divided highway with a positive barrier, the safest road classification in the file, the fatality rate at midmorning is 1.88. At 2 a.m. on that same road, it is 5.47. That is 2.91 times worse. On a divided highway with an unprotected median, 2.88 goes to 6.43. On undivided two-lane, 3.41 goes to 5.15. The effect holds on every road type, and the safest one takes the biggest hit. The interstate is the best place in America to crash a truck at ten in the morning and one of the worst places to crash one at two.
My first theory was Speed, and nobody was coming. Empty road, higher speeds, more energy in the impact. A wreck at 2 a.m. on an empty interstate does not get called in by the next car, because there is no next car. Somebody finds you when somebody finds you.
The theories die
The nobody-coming theory has a built-in test. A multi-vehicle crash comes with a witness, somebody standing there in a position to call it in. If the discovery gap were driving the overnight deaths, the crashes with no witness would take the worst beating in the dark.
They take the mildest. Single-vehicle truck crashes go from 2.23 deaths per hundred at midmorning to 3.01 at 2 a.m. That is 1.35 times worse. Multi-vehicle crashes go from 2.76 to 6.21. That is 2.25 times worse. Backwards. The truck that leaves the road at 2 a.m. with nobody around to find it is 35 percent more fatal. The truck that hits a car gets 125 percent deadlier. Whatever is happening at 2 a.m. is happening between two vehicles.
So I went and got better data. NHTSA runs a separate system for fatal crashes only, called FARS, and FMCSA publishes an extract of it. I pulled it for all 52 jurisdictions, 2019 through 2023. 27,973 fatal truck crashes, 31,856 dead people, and the crash file does not carry.
Start with who dies. The truck driver was among the dead in 4,947 of those crashes. That is 17.7 percent. In better than four out of five fatal truck crashes in this country, the person who died was not in the truck. That number does not move at night. It is 17.8 percent at midday and 18.3 percent overnight.
The trucker’s own drinking shows up. Police reported alcohol in 1.43 percent of daytime fatal truck crashes and 4.52 percent of overnight ones, more than three times as many. Even if every one of those crashes vanished, you do not close a gap between 2.66 and 5.27 with a factor that touches one crash in twenty.
Speed came back stronger. The average fatal truck crash at midday happens at 45.2 miles an hour. Overnight, it is 51.4. The share of fatal crashes happening at 65 or better goes from 15.3 percent at midday to 29.1 percent at 2 a.m. It is not geography: in urban areas, the overnight speed gap is larger than in rural areas. Crashes in which the truck ended up on the median ran at 52.7 percent at night, compared with a 35.5 percent baseline. Something is crossing the centerline at 2 a.m. more than it should be.
FARS only contains fatal crashes. Every row already has a dead person, so I cannot use it to prove that speed converts crashes into fatal ones. The file with all the crashes has no speed field. The file with the speed field has only the deaths. The speed finding is consistent, survives urban and rural controls, and is circumstantial.
Fatigue, the single most cited cause of night crashes in this industry, I could not test at all. FARS records up to four driver factors for the truck driver. In this extract, 26,584 of 27,973 records have that field empty, and there is no asleep or fatigued value anywhere in the data.
The blanks
The obvious remaining suspect was parking. The shortage is real, and the supply numbers are ugly. California and Texas together have 2,488 public truck parking spaces. Indiana by itself has 2,531. Measured against truck activity, California has 21.7 public parking spaces per thousand roadside inspections, Texas has 31.3, and Indiana has 503.2. A spread of twenty-three to one, and the worst two states are where the freight is. My extract of the federal public inventory totals 39,803 spaces nationally, within half a percent of FHWA’s own Jason’s Law count.
So I spent a day trying to connect that shortage to the overnight deaths, and I failed three times.
First, crashes. The crash file showed collisions involving parked trucks running nearly three times deadlier in the dark, and for about ten minutes, I thought I had it. Then I looked at the base: 43 deaths out of the 7,844 people killed in overnight truck crashes. Half a percent. Then FARS said stopped-truck fatal crashes are 7.9 percent by day and 8.2 percent at night, flat, and that almost all of those trucks were stopped on the roadway rather than parked on a shoulder. Two files, no signal.
Second, fatigue violations. Every roadside inspection record has a field for fatigue violations found. Across 26 states and 386,039 inspections, that field is zero. Not low. Zero. The column exists, and nothing has ever been written in it.
Third, hours violations. If a driver cannot find a legal spot, he keeps driving, and that is a 395.3 violation. So I ranked states by how often they write one, and it came out backward. California, the worst-parked state in America, writes them at ten times the rate of Texas, which has nearly identical parking. That table measures which states bother to write tickets, not parking.
Three swings, three misses. Every driver in America knows the shortage is real. 98 percent of them told FHWA they have trouble finding safe parking. The federal data cannot demonstrate that it hurts anybody, and I could not force it.
That failure is the finding. Driver factors in the fatal crash file: 95 percent empty; no fatigue value exists. Fatigue violations on roadside inspections: zero across every state. Every field that would let anyone measure why trucks kill people at two in the morning is blank. The columns exist. Somebody wrote the specification, printed the form, and shipped the database. Nobody fills them in.
Hours of service is a fatigue rule. Every number in it exists because the federal government decided tired drivers kill people. Thirty years of rules, and the federal government does not measure fatigue. It regulates a cause it has no instrument for.
It was the other driver all along
Every file I had used to that point shared one design choice. The crash file records whether the truck driver was cited, but not anything about the other driver. The FMCSA fatal extract codes every field for trucks and buses only. Both files put the trucker under a microscope and leave the other driver blank.
NHTSA’s full FARS person file does not. It includes a blood alcohol result for every driver in the crash, linked to the vehicle they were in. I pulled the 2024 national file: 5,055 fatal crashes involving a heavy truck. For the first time, I could stand the truck driver and the other driver side by side and ask which one had been drinking.
Take fatal truck crashes and look only at the non-truck drivers, the people in the other vehicle, and only the ones tested for alcohol. From 9 a.m. to 3 p.m., 9.9 percent of them were over the legal limit. From midnight to 6 a.m., it was 49.9 percent. Half. That is five times the daytime rate.
Now, the truck driver stands next to him in the same crash. Truck drivers over the limit: 3.3 percent by day, 10.4 percent at night. The trucker’s number goes up at night too, but 10.4 against 49.9 is not a close call. In the crashes that are killing people at 2 a.m., the car driver is roughly five times more likely to be the drunk one.
Here is the crash-level version. Overnight, one in five fatal truck crashes involved a legally drunk driver: 20.8 percent, against 5.1 percent in daylight. Split that overnight number by who was drunk, and it was the car driver in 18.5 percent of crashes and the truck driver in 2.5 percent. Seven to one.
Every thread from the first three sections ties off right here. The citation rate for the truck driver did not change at night because the truck driver did not primarily cause the crash. The truck driver was not usually the one who died because the truck driver was in a heavy vehicle. The overnight deaths concentrated in multi-vehicle crashes because the killer was in the other vehicle. The speed was higher because a drunk driver at 2 a.m. on an empty road is not braking.
Two caveats. The other driver gets tested for alcohol 46 percent of the time; the truck driver gets tested 22 percent of the time. The trucker’s 10.4 percent is a floor, not a ceiling, though you would have to nearly quintuple it to catch the car driver. FARS is fatal crashes only, so this is a statement about the composition of fatal truck crashes at night, which is exactly the question the series has been asking, not a statement about how often trucks and drunks collide in general.
This is not a story about trucking getting a pass. Twenty-five hundred people a year still die in crashes where the truck driver was the drunk one, and 10 percent of truckers in these night crashes being over the limit is 10 percent too many. The drug and alcohol clearinghouse exists for a reason, and this data is not an argument against it.
It reframes the overnight problem. For thirty years, the entire regulatory apparatus aimed at night truck deaths has pointed at the truck driver. Hours of service, the fourteen-hour clock, the electronic logging device, the 1 to 5 a.m. restart provision. Every one of those rules is built on the theory that the danger at 2 a.m. is the tired trucker.
The data says the danger at 2 a.m. is a drunk in a car hitting a truck that is doing nothing wrong. You do not fix that with a logbook. You do not fix it with an ELD. You fix it, if you fix it at all, on the four-wheeler side of the yellow line, which is the one side thirty years of trucking regulation never looks at.
One point two million crashes. The kill rate doubles at 2 a.m., and the fault rate does not move. We have been arguing about the wrong number.
Another fascinating article that has me envious of the access to statistics you have!