

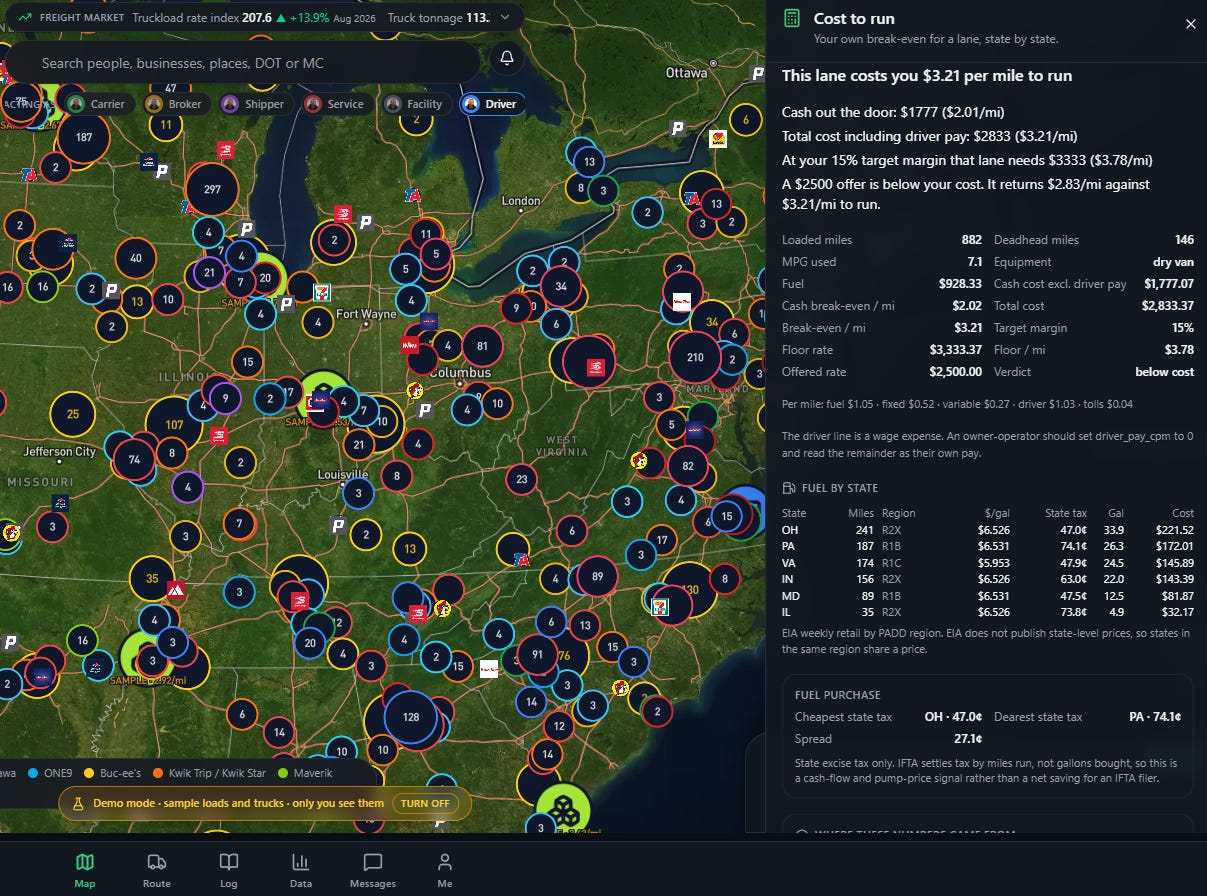
As a driver, I often wanted to know where I'd stop, where enforcement was heavy, where crash risk was high, etc., so I could better plan my trip.
As a carrier, I wanted to work with the best shippers and brokers to make sure I’d be paid and the load made money.
As a broker, I wanted the best carriers to not only get my freight to its destination but also keep my shipper happy.
As a risk guy, I wanted to make sure our clients understood what risk meant beyond compliance.
I realized all of this required a tremendous amount of networking power. I also realized that identity, disclosure, and accountability are key. So we built what amounts to a planning networking load board that is free to access, but the minute you want to interact, you've got to validate with facial recognition. From there, you can post loads, post a truck, post a job, apply for a job, plan your route, and post a service as a vendor, but we don't do anonymous. We even dropped the flock sensors into the map because this app is about identity and transparency as much as it is about networking and industry connection.
Let’s run through a load. Yorktown, Virginia, to Elk Grove Village, Illinois. 882 loaded miles, 146 deadhead, a dry van getting 7.1 miles per gallon. Somebody offers $2,500. It sounds like real money until you do the math. Fuel across six states comes to $928. Fixed costs, wear, and driver pay bring the total to $2,833, or $3.21 a mile. The $2,500 offer pays $2.83 a mile. You’d be paying to haul it.
Araynge did that math in about a second, state by state, using this week’s diesel price for each region and each state’s fuel tax. The verdict at the top says below cost. A 15% margin on that lane needs $3,333. That’s the number to counter with, and now you know it before you pick up the phone.
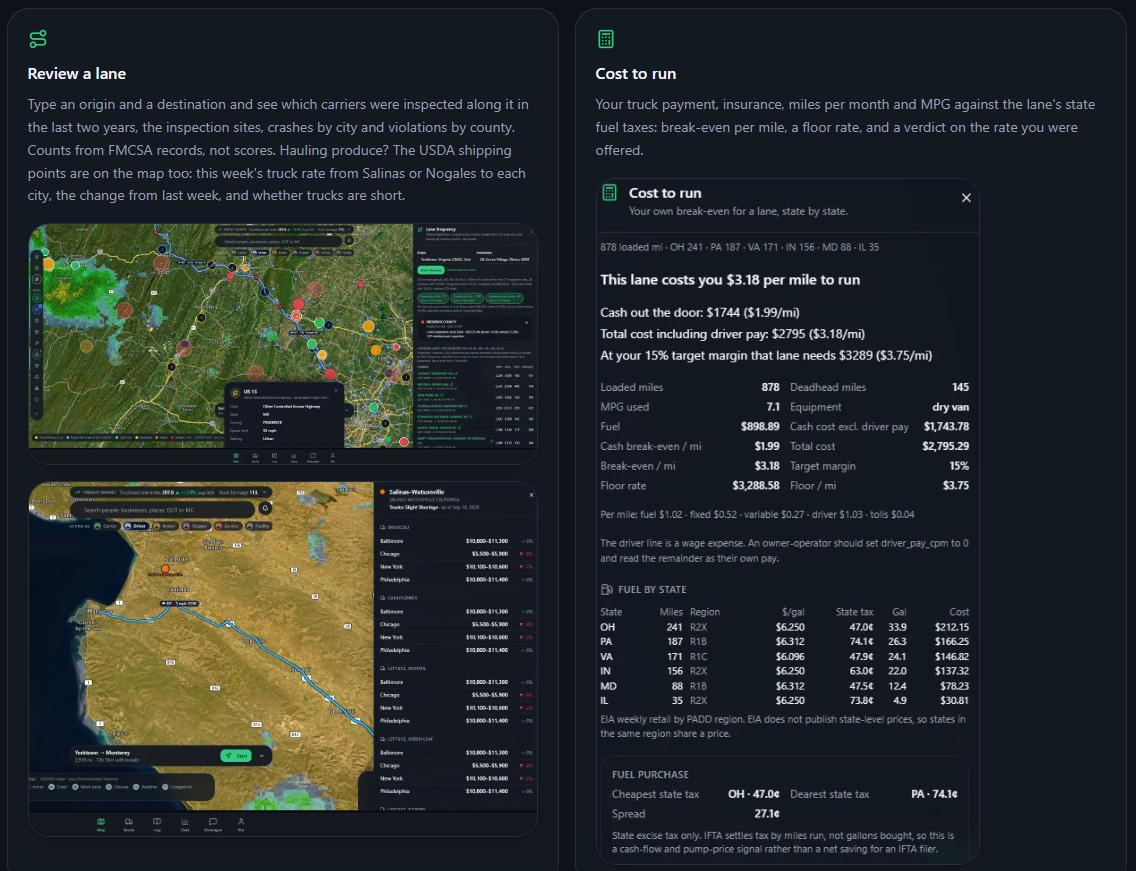
Cost to run prices the lane state by state against this week’s diesel and fuel taxes, then tells you whether the offered rate covers it.
Every industry seat has the same problem. The information exists, but it's scattered. The route lived on a phone, the clearance on a sign, the scale report on the CB, the state’s rules on a website, the carrier’s record in a federal database, and the load in a text message. Araynge is the map I wanted in every one of those seats. Building it was the most fun I’ve had this year.
A route built for your truck
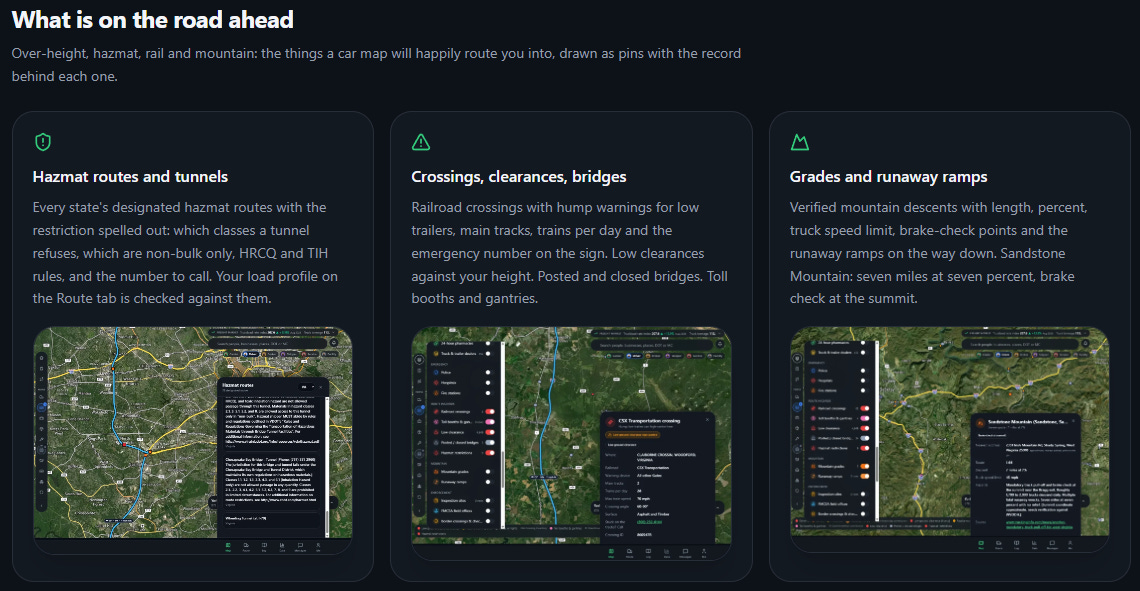
Routing starts with the truck, not the destination. Put your truck on file: height, width, length, gross weight, and axles. Decode the VIN, and Araynge fills in the engine and typical fuel economy. Hazmat is built in by class, with bulk, highway-route-controlled quantity, inhalation-hazard flags, and the UN number. Araynge builds a large-vehicle route across the lower 48. Then it runs a second check along the line for everything a router misses: low clearances against your height, posted and closed bridges, hazmat restrictions and tunnels, railroad crossings with hump warnings for low trailers, and mountain grades with their length, percent, and truck speed limit.
Routing that knows your truck: dimensions, weight, axles, and hazmat on file, checked against route restrictions.
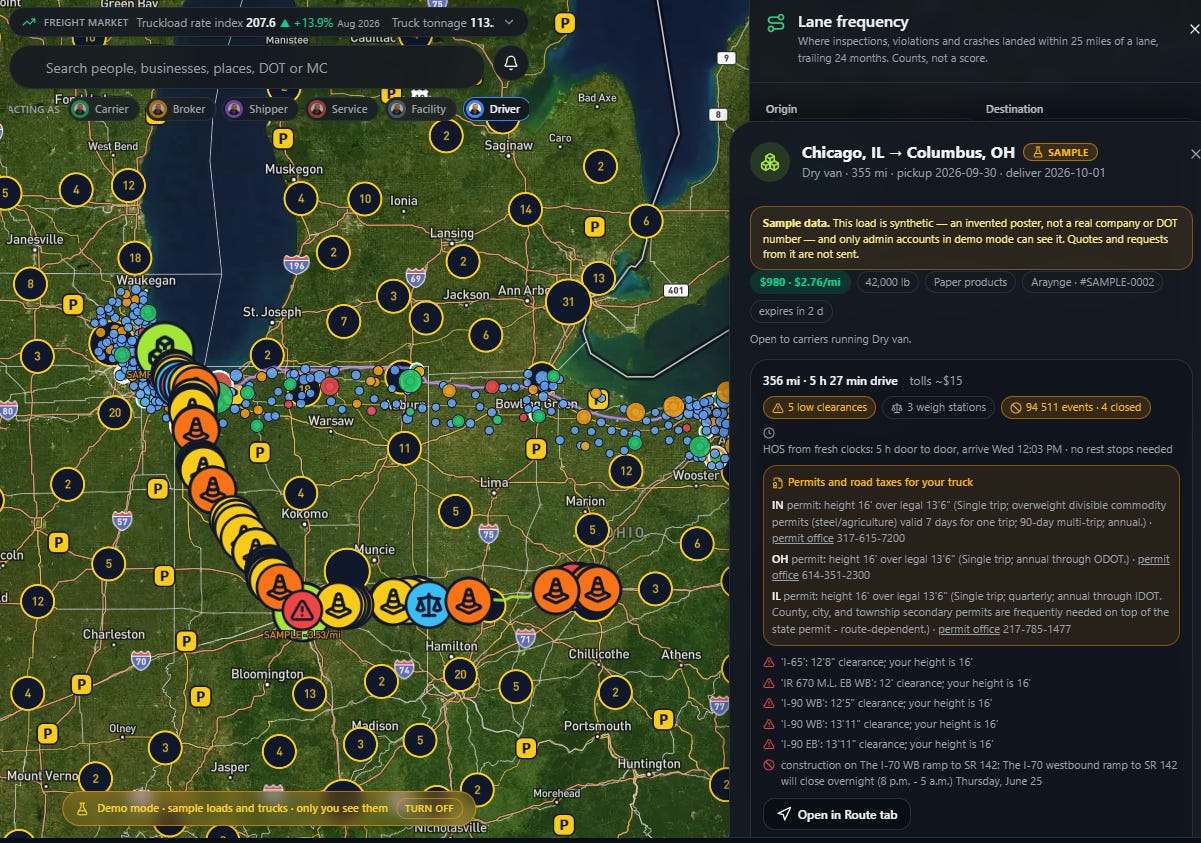
Here’s what that looks like on an oversize demo load from Chicago to Columbus, Ohio, at 16 feet tall. Araynge flags five low clearances on the route, from 12 feet up to 13 feet 11 inches, each one a problem for a 16-foot load. It lists the permit each state requires for a load over the legal 13 feet 6 inches, with the permit office phone number for Indiana, Ohio, and Illinois. It counts three weigh stations on the way, flags a planned overnight ramp closure, and checks the trip against a driver’s fresh hours-of-service clock. That’s a sample load in demo mode, labeled as one. The checks are the same on a real one.
A sample oversize load shows five low clearances, the required state permits and permit office numbers, three weigh stations, and an overnight closure. Demo data.
Hours of service are built into the route. Range shows how far you can get from where you are in 2, 4, 8, and 11 hours of driving, 11 being the federal driving limit under 49 CFR 395.3, and filters the truck stops and parking on the map to what’s actually inside each band. The panel tells you plainly that those bands use car drive times, not truck routing, so they’re for seeing what’s roughly in reach. The Route tab does the real truck planning.
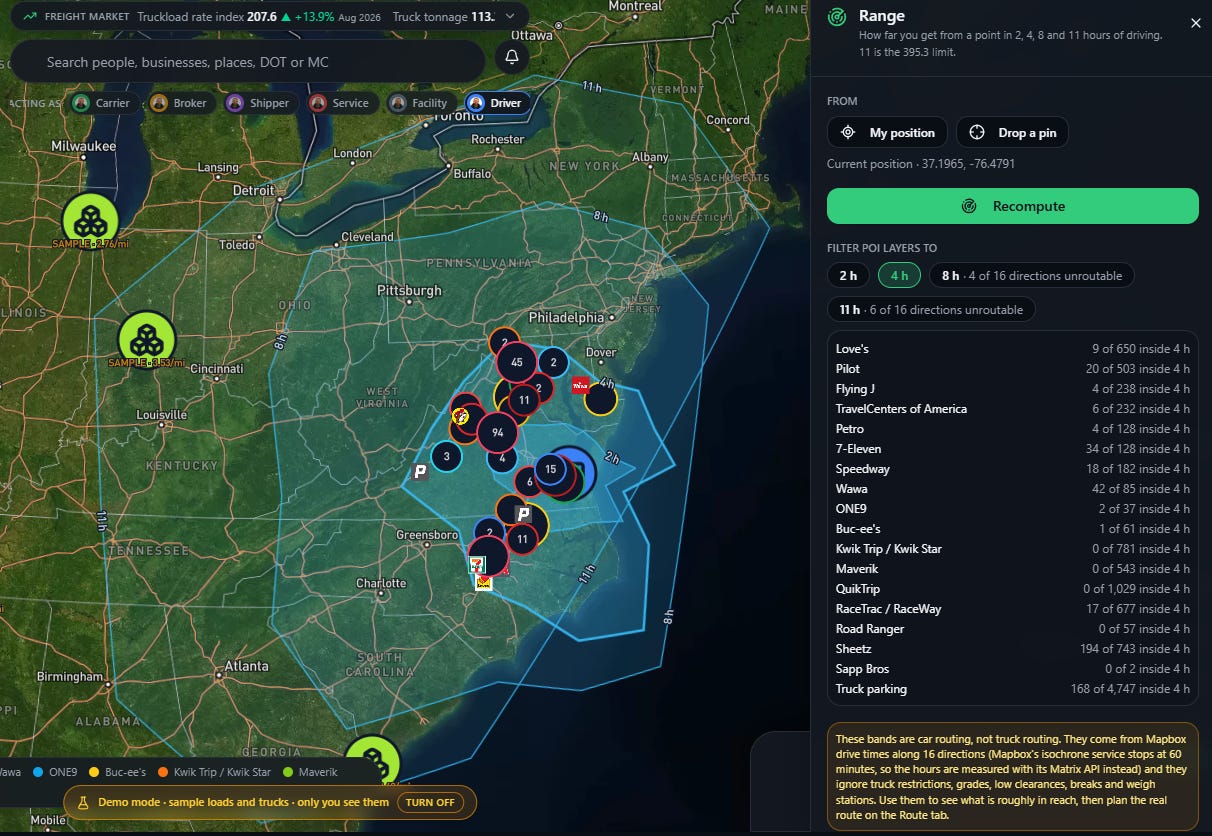
Range shows how far you can drive in 2, 4, 8, and 11 hours and counts the truck stops and parking inside each band. The position is blurred. Best part: you can also ask the system what the optimal stops are within 2, 4, 8, and 11 hours.
What’s down the road
Parking is where a driver’s day goes wrong. In the Federal Highway Administration’s Jason’s Law truck parking survey, more than 75% of truck drivers said they regularly have trouble finding safe parking when they need rest, and 90% said it’s worst at night. Araynge shows Truck Parking Club listings and more than 5,600 public rest areas and lots, plus weather and live 511 incidents along the route, so you can see the storm and closures before you get there.
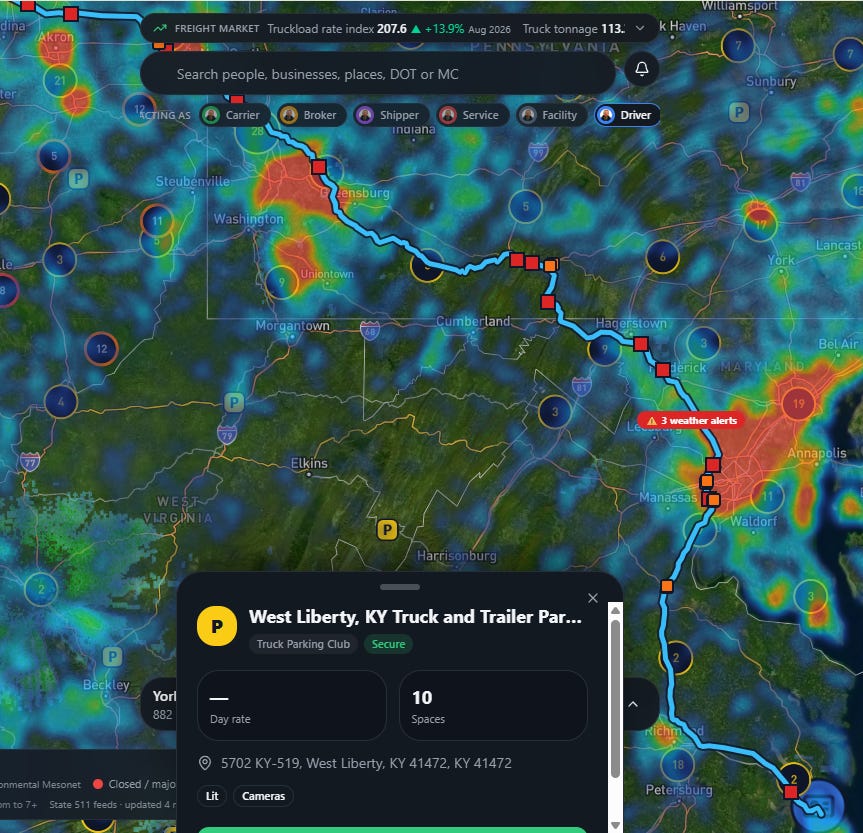
Weather over the route, plus a Truck Parking Club listing of open spaces, lighting, and cameras.
Every weigh station on the map is colored by what drivers reported in the last two hours. Roll toward one, and an alert fires within 15 miles; one tap reports it open or closed for the next driver. Tap a state, and Araynge shows whether it adopted the federal regulations, its weight threshold, whether it issues citations, and its diesel tax, each dated and linked to the official source.
Scales are colored by recent driver reports, traffic cameras, live 511 incidents, and each state's rules.
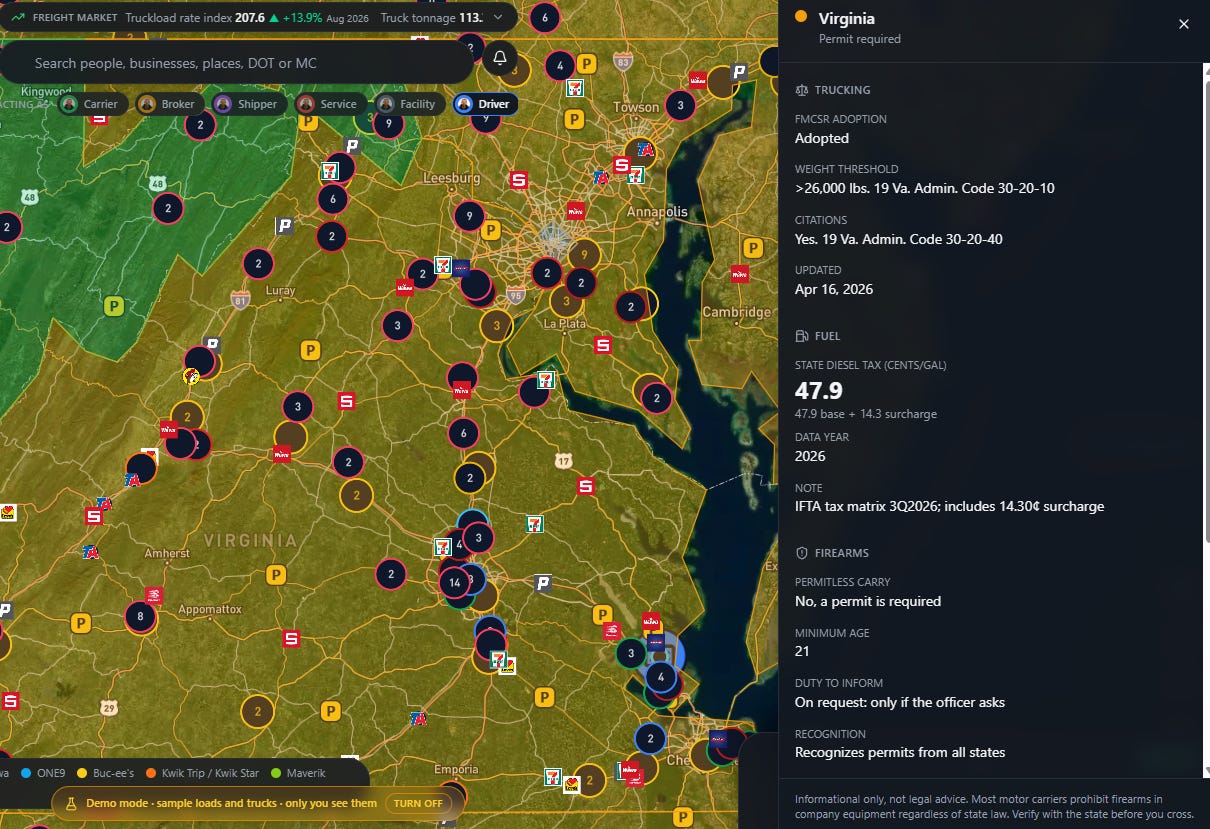
State-by-state trucking and Firearm carry rules: FMCSR adoption, the 26,000-pound weight threshold and its citation, and the state diesel tax, with the date and source.
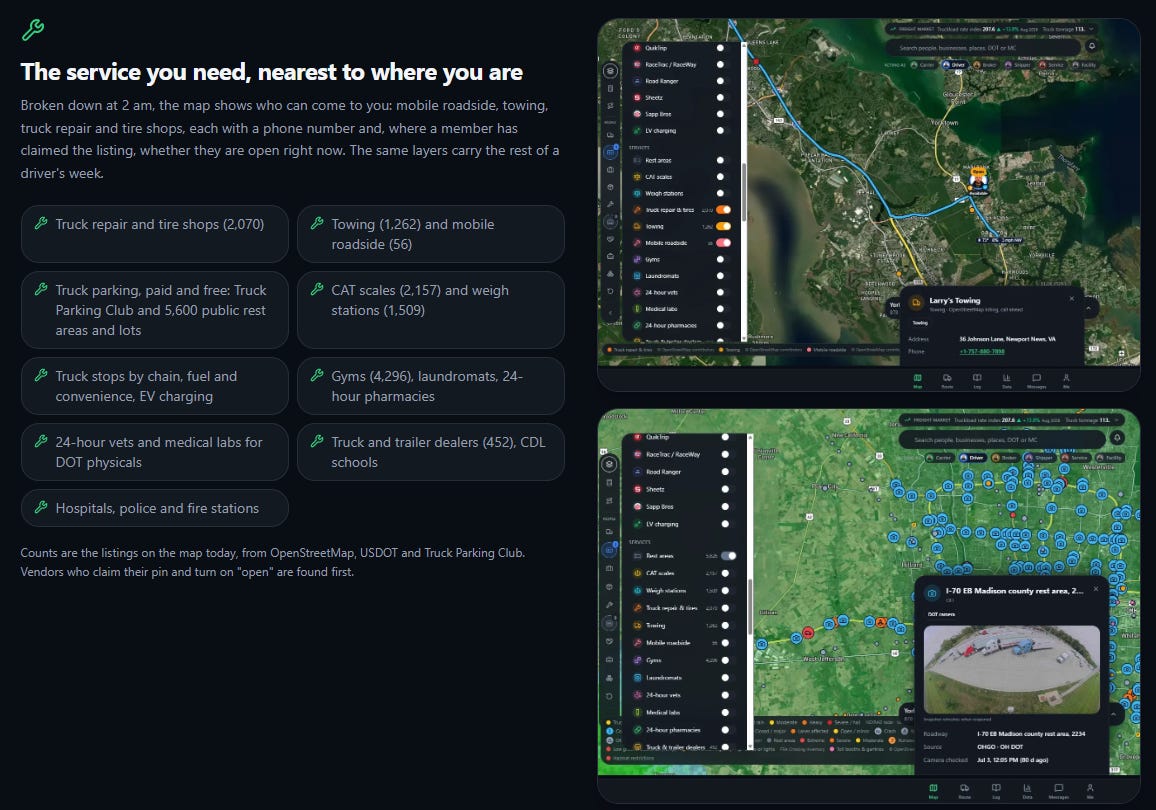
Broken down at 2 a.m., a general search engine fails a truck driver worst. Araynge’s service layers show who can come to you: 2,070 truck repair and tire shops, 1,262 towing listings and 56 mobile roadside services, each with a phone number. The site also lists 2,157 CAT scales, 1,509 weigh stations, truck and trailer dealers, CDL schools, DOT physical providers, 24-hour pharmacies, hospitals, and police. Vendors who claim their listing and switch it to open show up first.
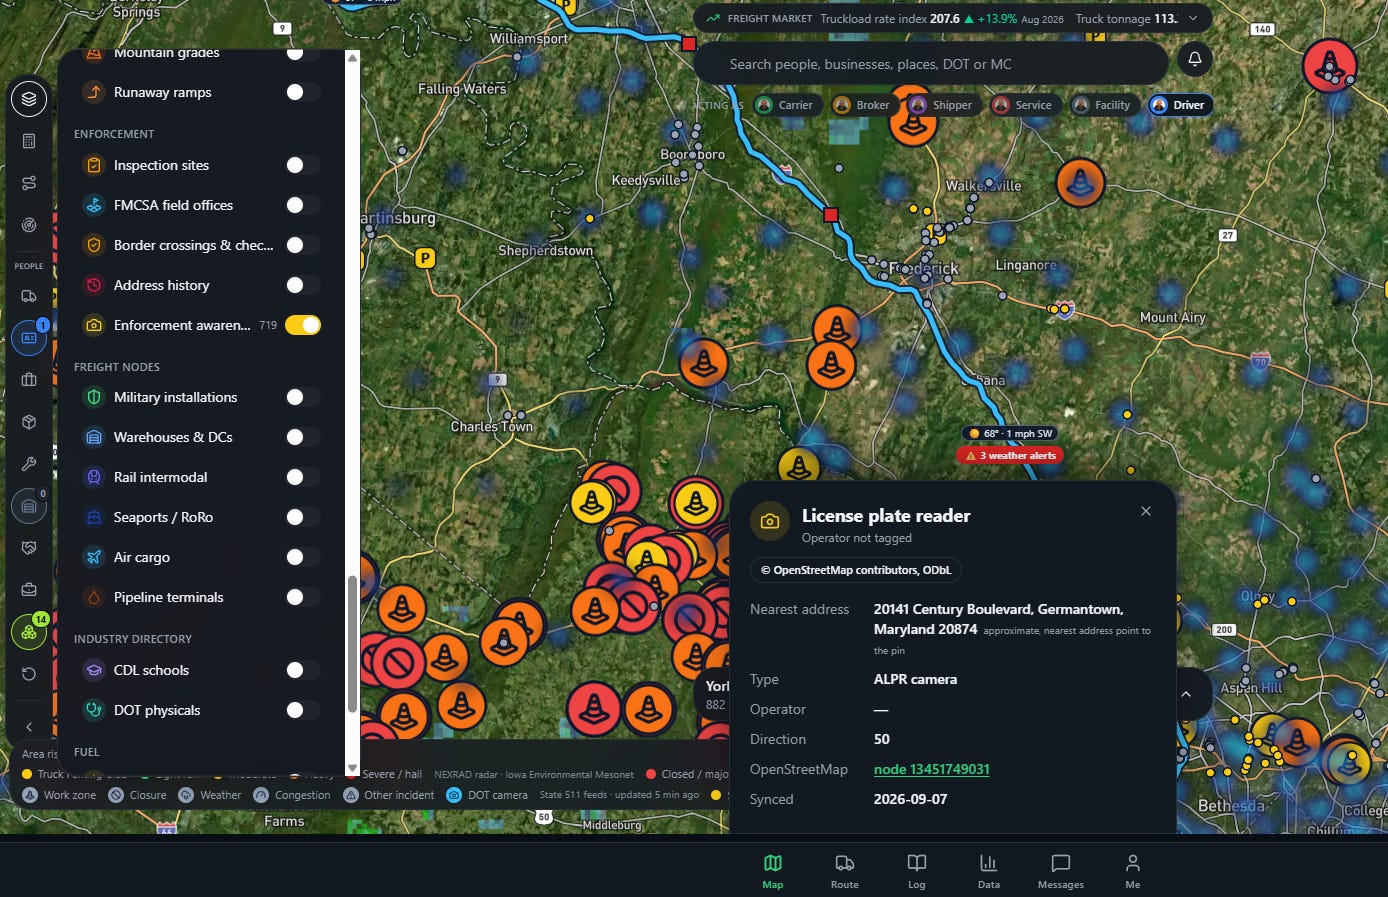
Every layer runs on one toggle: route hazards, mountain grades, enforcement, freight nodes, services, and live data.
Know the lane before you take the load
Type an origin and a destination, and Lane frequency shows what happened along that road in the last two years. On the Yorktown to Elk Grove Village run, within 25 miles of the line, that’s 57 inspection sites, 89 counties with 113,741 inspections and 176,365 violations, 21,186 of them out-of-service, and 23,261 crashes, 425 of them fatal. Tap a county for its details. Frederick County, Maryland, alone logged 11,774 violations on 6,694 inspections, with 2,072 inspections ending in an out-of-service order. The panel also lists the carriers inspected most often in those states. Every number is a count from FMCSA records, not a score, and the page says so.
Lane frequency counts the inspections, violations, and crashes within 25 miles of the route over 24 months. Origin and carrier names are blurred.
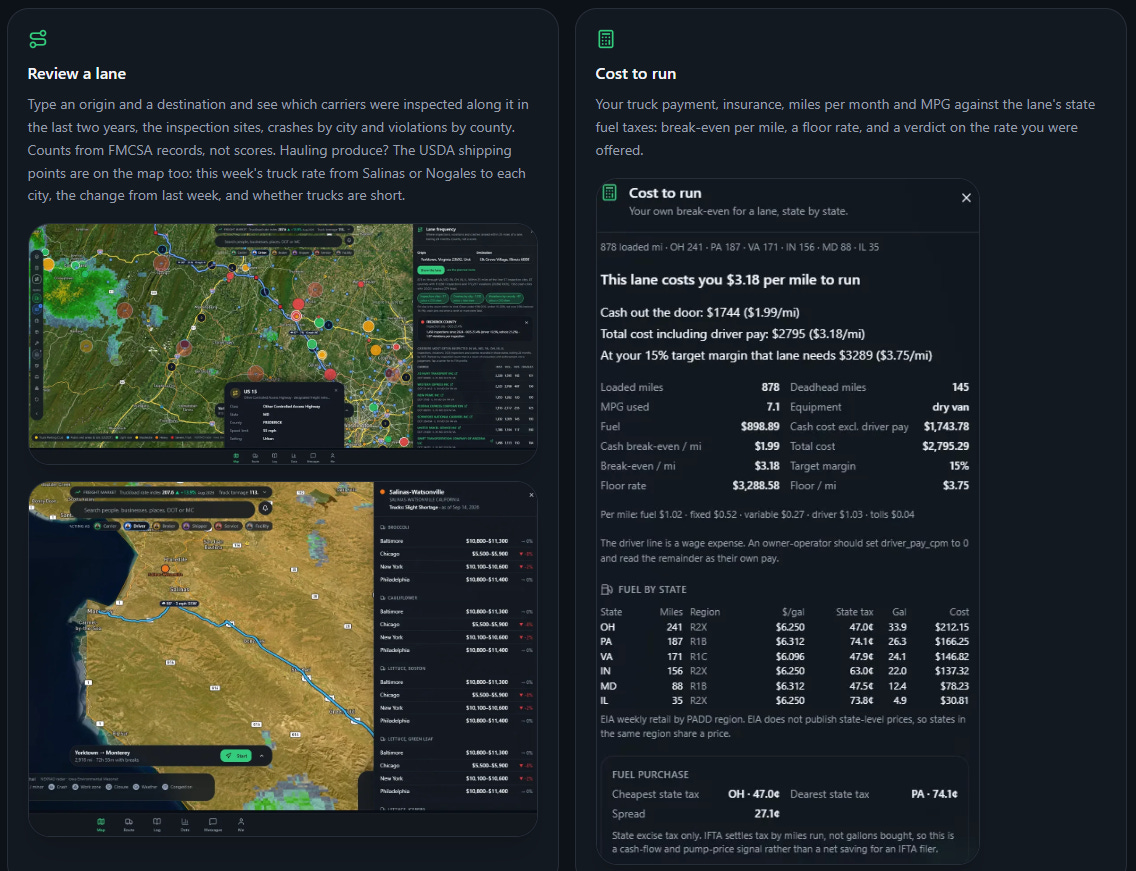
Review a lane alongside its operating cost, including USDA produce rates from shipping points like Salinas and Nogales.
Hauling produce? The USDA shipping points are on the map with this week’s truck rate to each city, the change from last week, and whether trucks are short. The freight market sits across the top of the map: the producer price index for long-distance truckload was 207.6 in August, up 13.9% from a year earlier, according to the Federal Reserve’s FRED data.
The load board, with people you can check
A carrier posts a truck as empty and available, or as a backhaul showing where it’s trying to get to. A broker or shipper posts a load with origin, destination, equipment, weight, oversize, hazmat by UN number, and a minimum vetting score for who can respond. Verified carriers answer, and the parties contract directly. Araynge never touches the freight money.
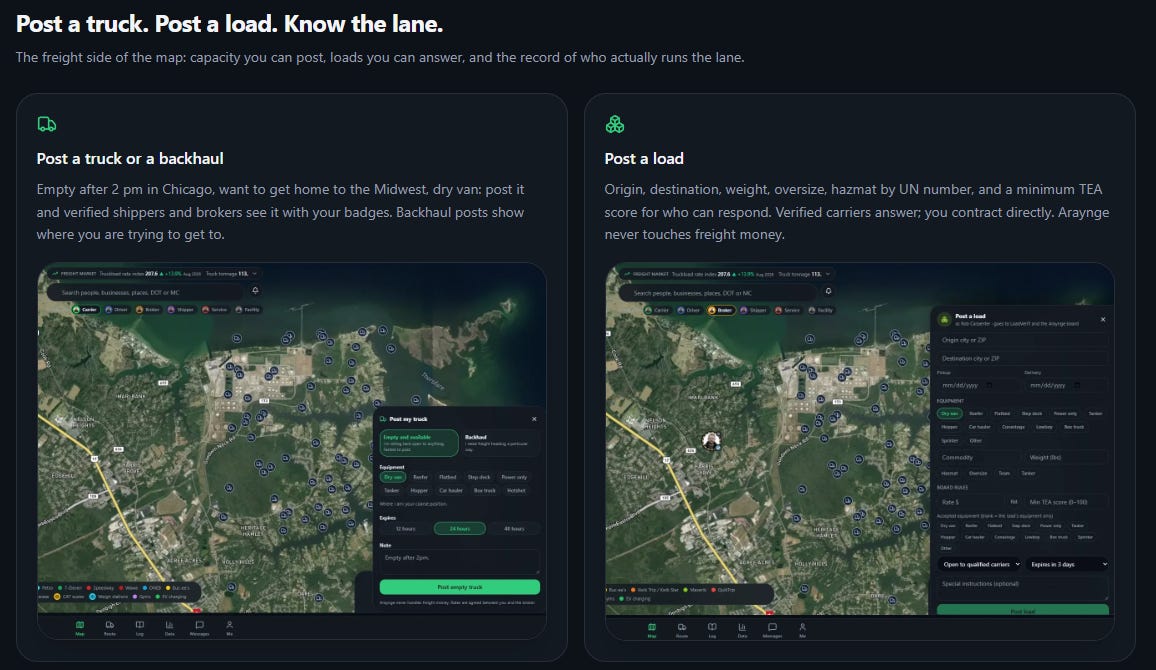
Post a truck or a backhaul, or post a load with a minimum vetting score for responders.
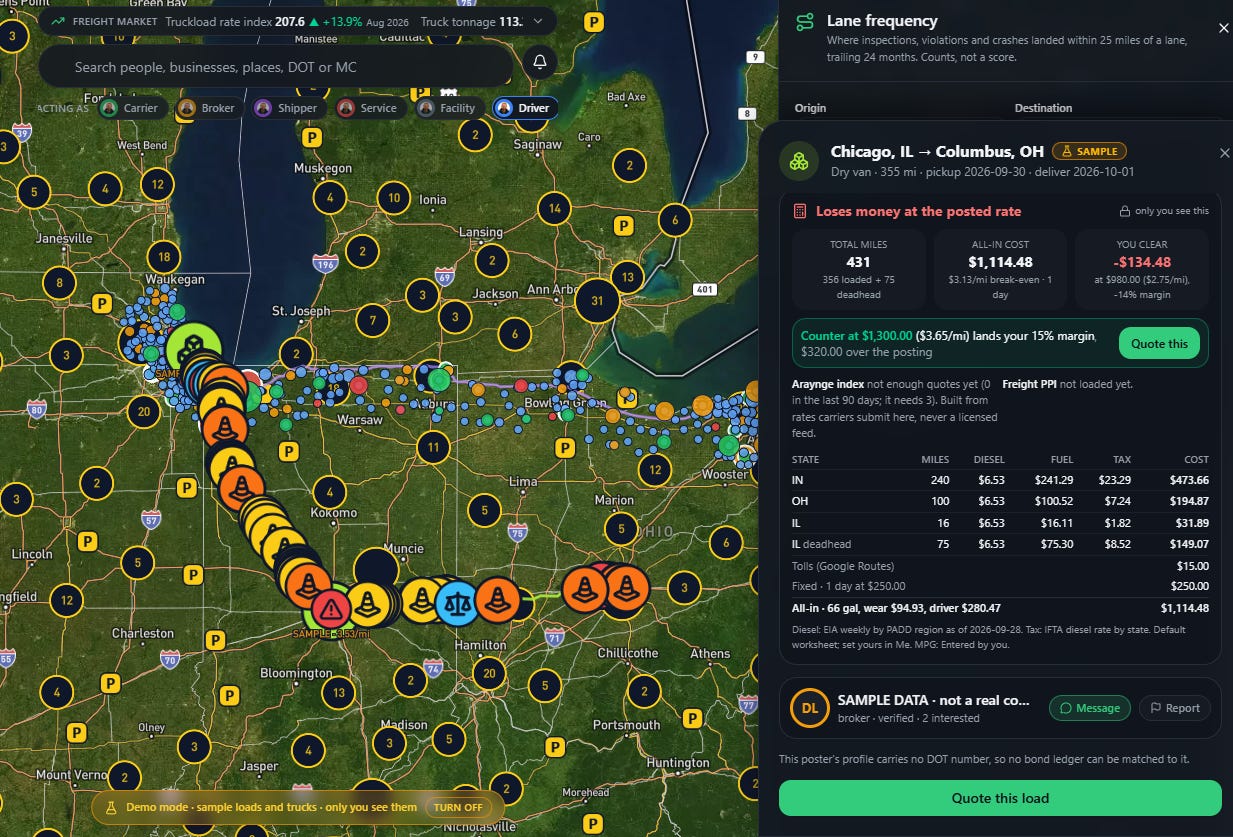
Every load card does the cost math too. On a sample Chicago to Columbus dry van load posted at $980, Araynge works out 431 total miles with deadhead and an all-in cost of $1,114. That means the driver loses $134 at the posted rate, and $1,300 is the counter that lands a 15% margin. One tap sends the quote.
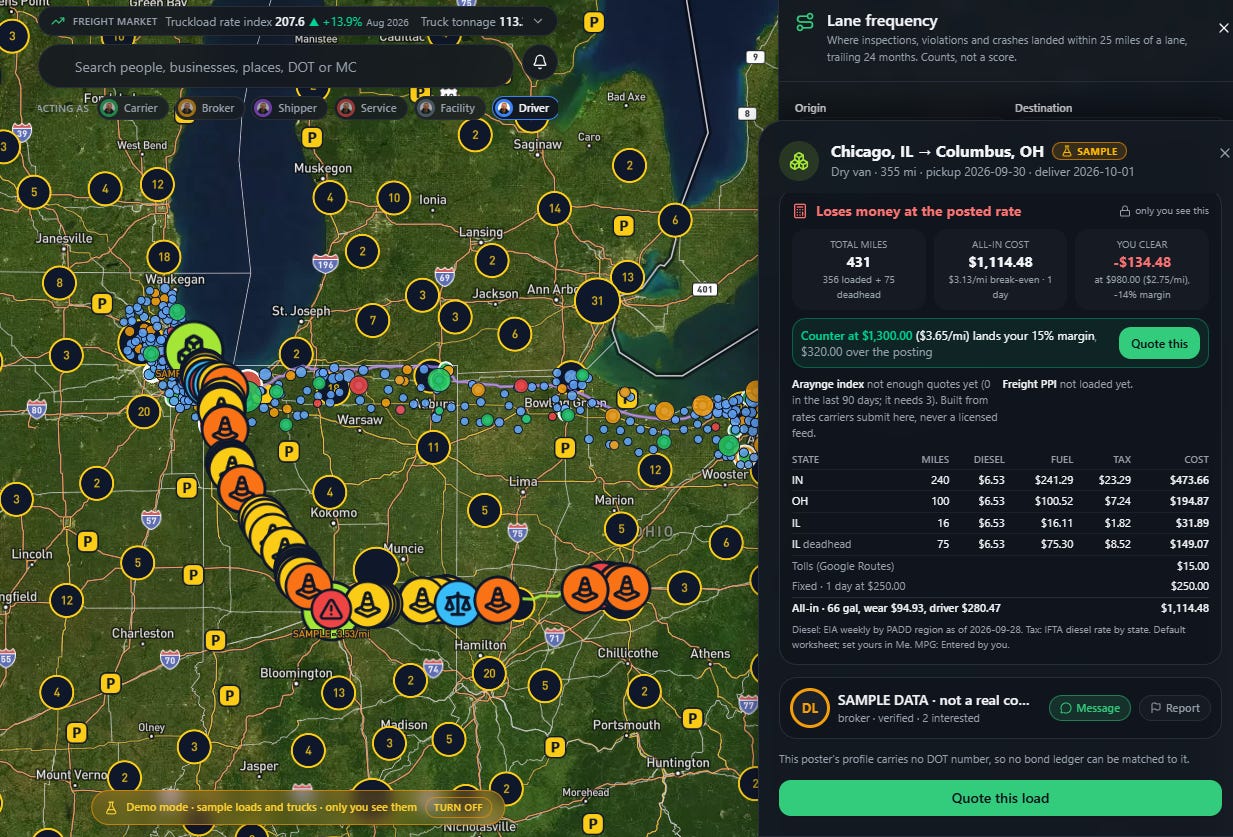
A sample load shows it loses money at the posted rate and suggests a counter. Demo data.
Fake loads and double brokering start with people pretending to be somebody else, so trust is built into the map. Everyone who acts on it verifies their identity once with a government ID and a selfie. Then they attach a credential: a CDL, DOT authority plus insurance, or broker authority plus a bond. You choose what others see, and a coarse location stays coarse until you match. Verify once, and Araynge, LoadVerifi, CarrierVerifi, and DriverVerifi all recognize it.
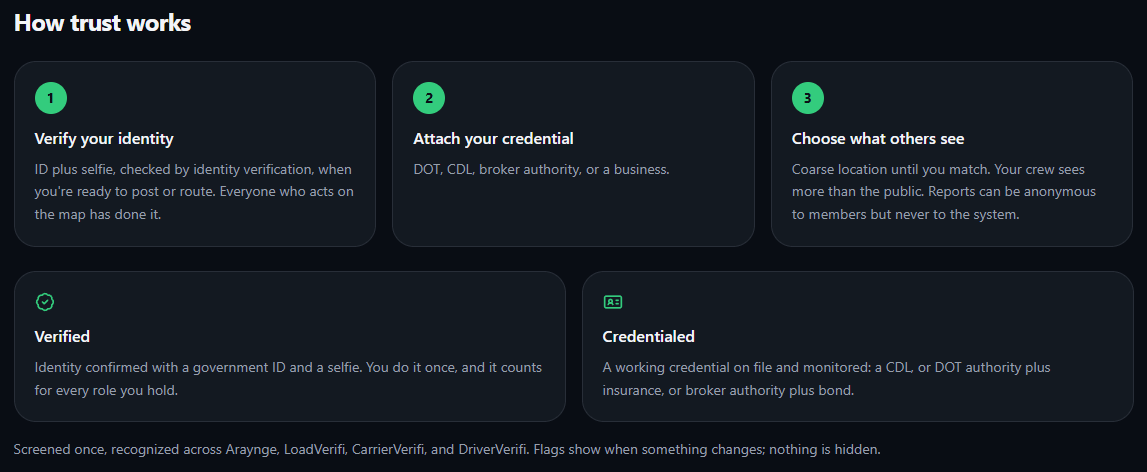
Verify once with an ID and a selfie, attach a working credential, and choose what others see.
Behind every Pin is the public record. Tap a carrier or broker to see the legal name, DOT and MC, authority and insurance on file, the process agent, officers, power units, drivers, safety rating, and the MCS-150 dates. You also get a Street View frame of the listed address, labeled yard, storefront, residence, or mail drop, with a count of how many other carriers share it. You can see before you book whether a broker's office is an apartment.
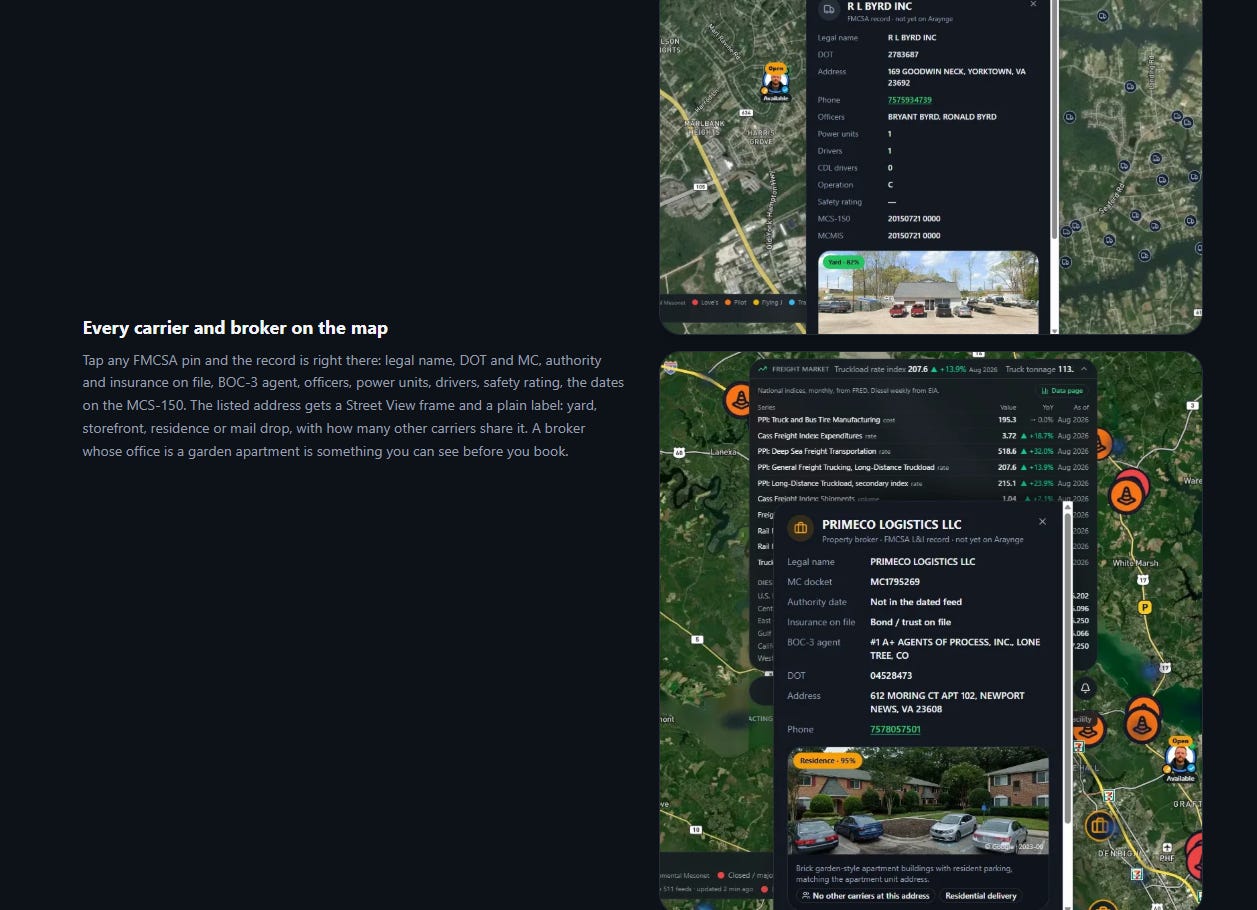
Carrier and broker cards show the FMCSA record and a labeled Street View of the listed address. Names and details are blurred.
Jobs, data, and who it’s for
CDL jobs and the office, shop, and yard jobs behind them show on the map as one pin per city. Each employer is matched to its FMCSA record, so a driver sees who they’d be working for before they apply. Carriers post jobs with their badges, and drivers can flag themselves open to work.
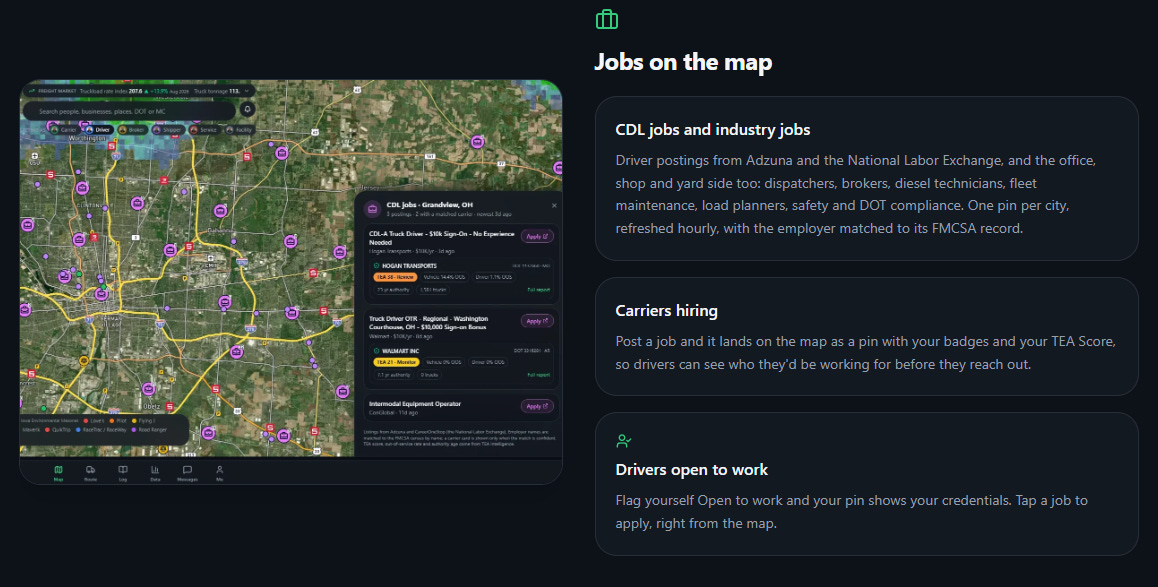
CDL jobs on the map, each employer matched to its FMCSA record. Employer details are blurred.
The Data tab turns the same public records into 14 pages: inspections, crashes, insurers, shippers, hazmat incidents, broker bonds, ELDT schools, plus market data from FRED, Cass, the EIA and USDA. Every chart names its source and as-of date and downloads as a CSV. They’re counts, not grades.
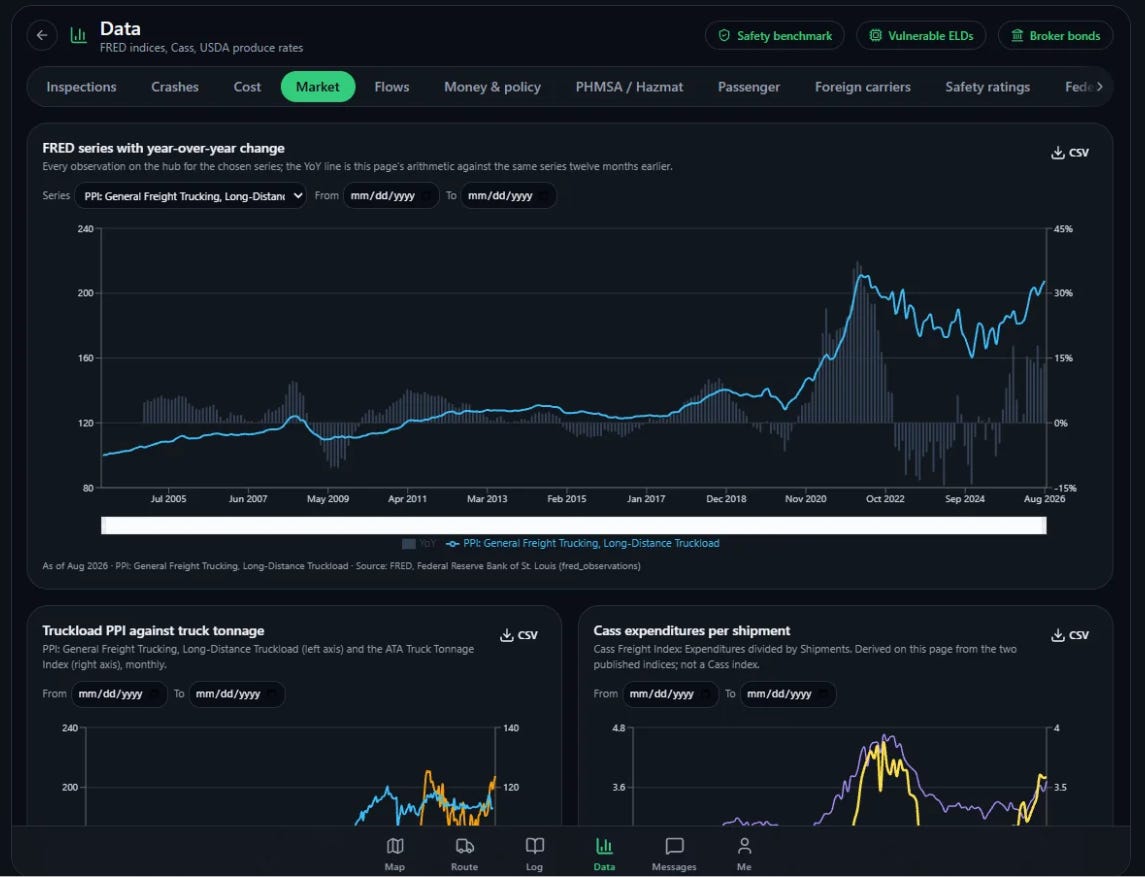
The Data tab’s market page charts FRED freight series with year-over-year change, the truckload index against truck tonnage, and Cass expenditures per shipment.
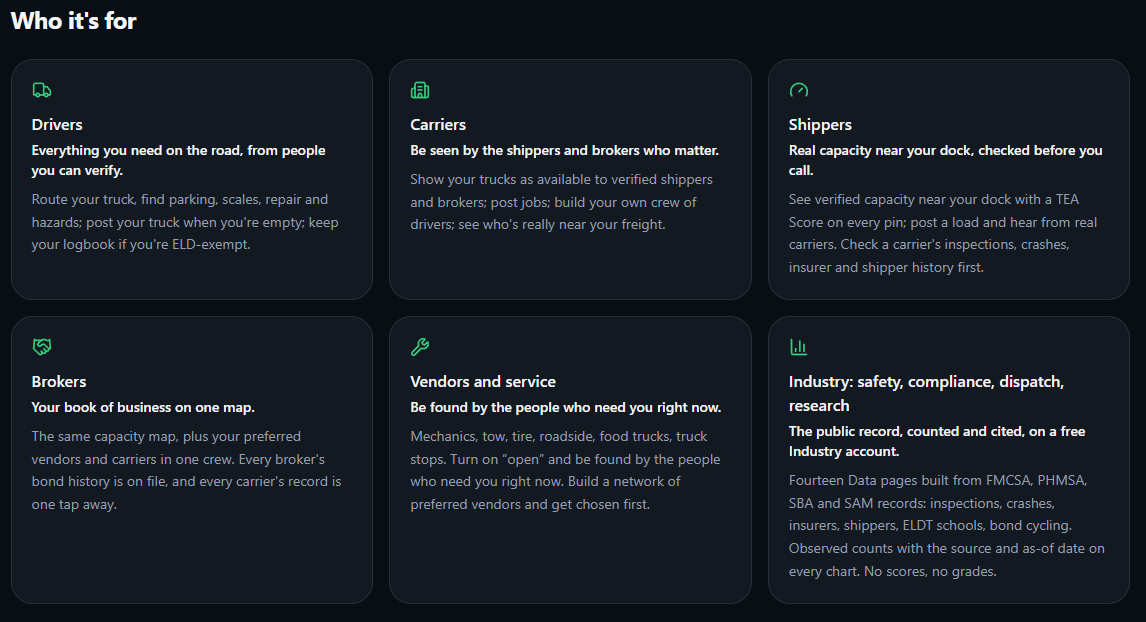
Araynge is built for drivers, carriers, shippers, brokers, vendors, and the industry’s safety, compliance, and research staff.
What it costs
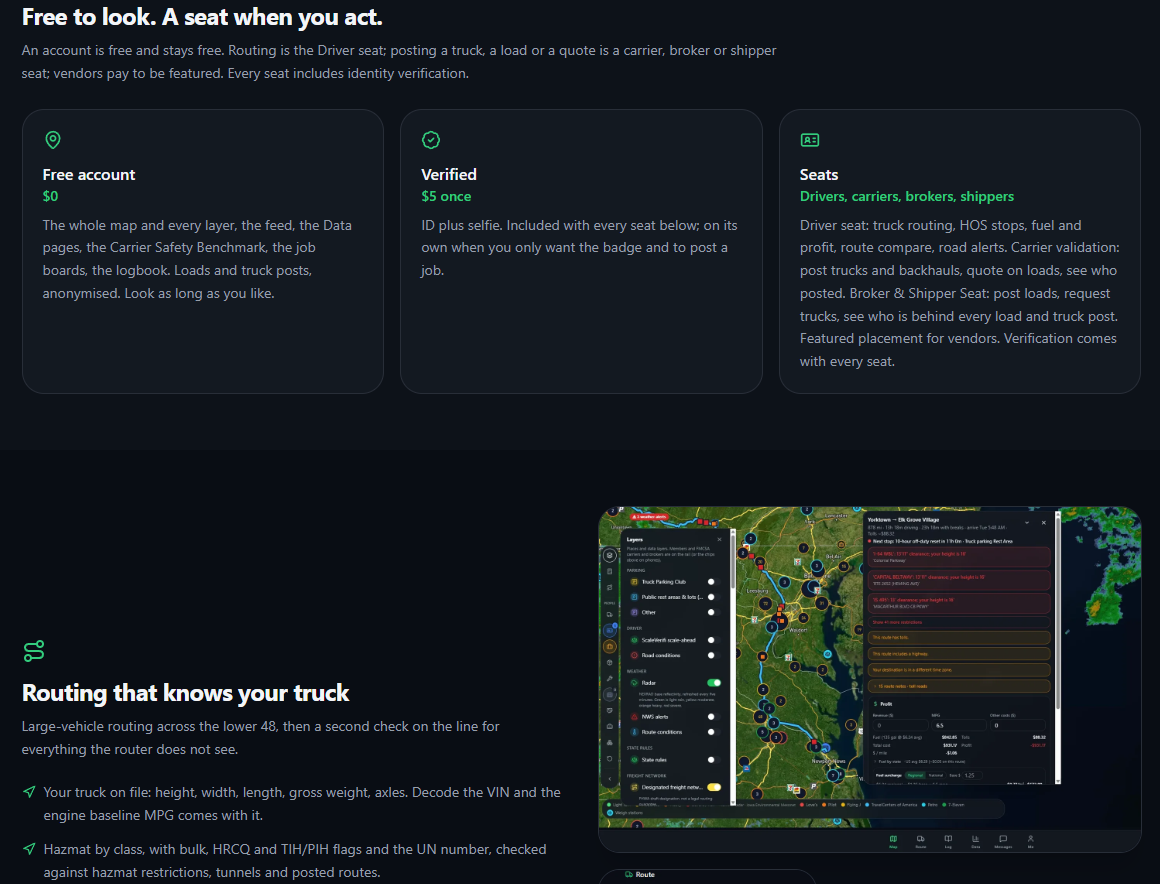
An account is free and stays free. That covers the whole map and every layer, the Data pages, the safety benchmark, the job boards and the logbook for drivers exempt from the ELD rule, with loads and truck posts shown without names. Verification is $5 once, ID plus selfie. Truck routing with restriction checks, clock stops, fuel, and profit is the Driver seat at $9.99 a month. Carriers, brokers, and shippers who post, quote, and see who’s behind a listing buy a seat, and every seat includes verification.
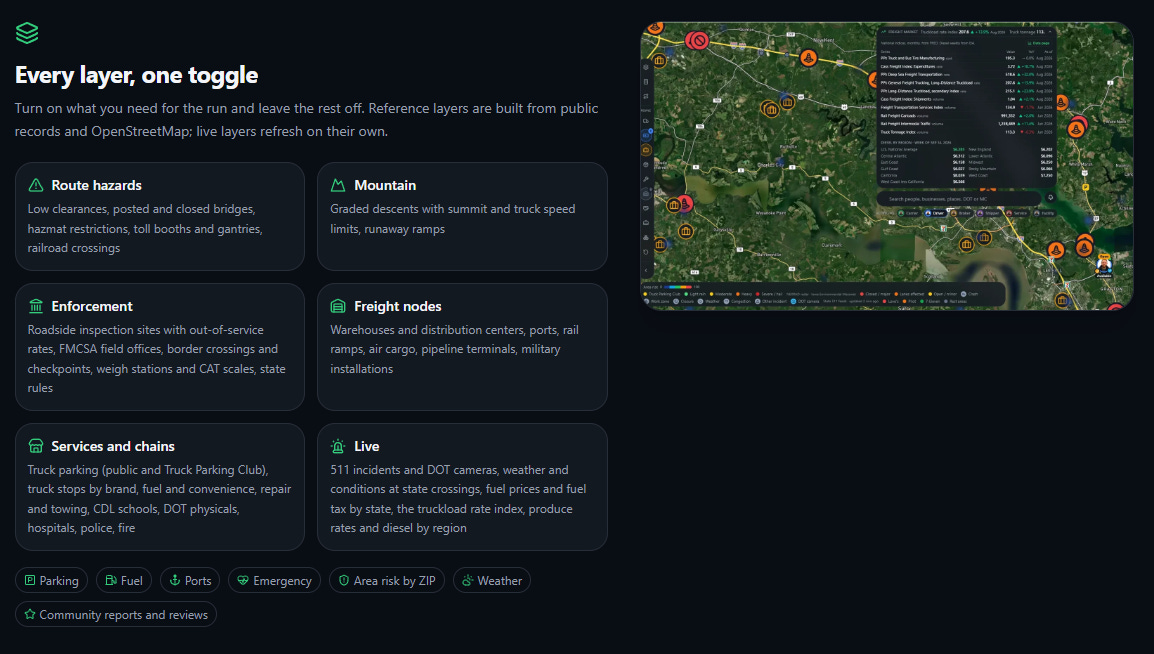
Araynge runs today in any browser, on the desktop at a broker’s desk or on the phone in the cab. On Android, you can install it to your home screen straight from the website. The App Store and Google Play versions are in review now.
Everything on this map was already public: the clearance in the bridge inventory, the crossing in the federal file, the crash in FMCSA’s records, the diesel price at the EIA. What drivers and brokers never had was all of it on one screen when they had to decide.
That $2,500 load is still out there. Now you know what it costs before you take it, who posted it, who’s bidding to run it, and where their truck is in respect to the load.
Rob Carpenter is the founder of Tea Technologies, Inc., which owns Araynge, LoadVerifi, CarrierVerifi, and THE TEA Highway Intelligence Platform. He is vice president of compliance at TruckSafe Consulting and an expert witness in commercial motor vehicle litigation.